The Regional Trends section of the Traffic & Market Toolkit delivers geographical insights about your competitors' reach and audience distribution. These dashboards reveal where websites attract visitors, which regions show growth, and how traffic patterns vary across geographic segments.
Business development teams can pinpoint untapped, high-potential markets while international marketers uncover regional engagement differences.
These dashboards offer access to:
- Traffic data across 190 countries and regions
- Insights into audience distribution by state, country, and broader regional segments
- Analysis of desktop versus mobile usage by location
- Historical traffic trends by geographic area
- Engagement metrics by region
- Comparison tools for competitive analysis
These insights can help you make data-driven decisions about market expansion, regional content strategy, and localized marketing campaigns that drive international growth.
Getting started with the Regional Trends dashboards
The Get Started menu is your entry point into the Semrush Traffic & Market Toolkit. It’s designed to help you quickly enter domains and move into your analysis of their traffic and marketing performance.
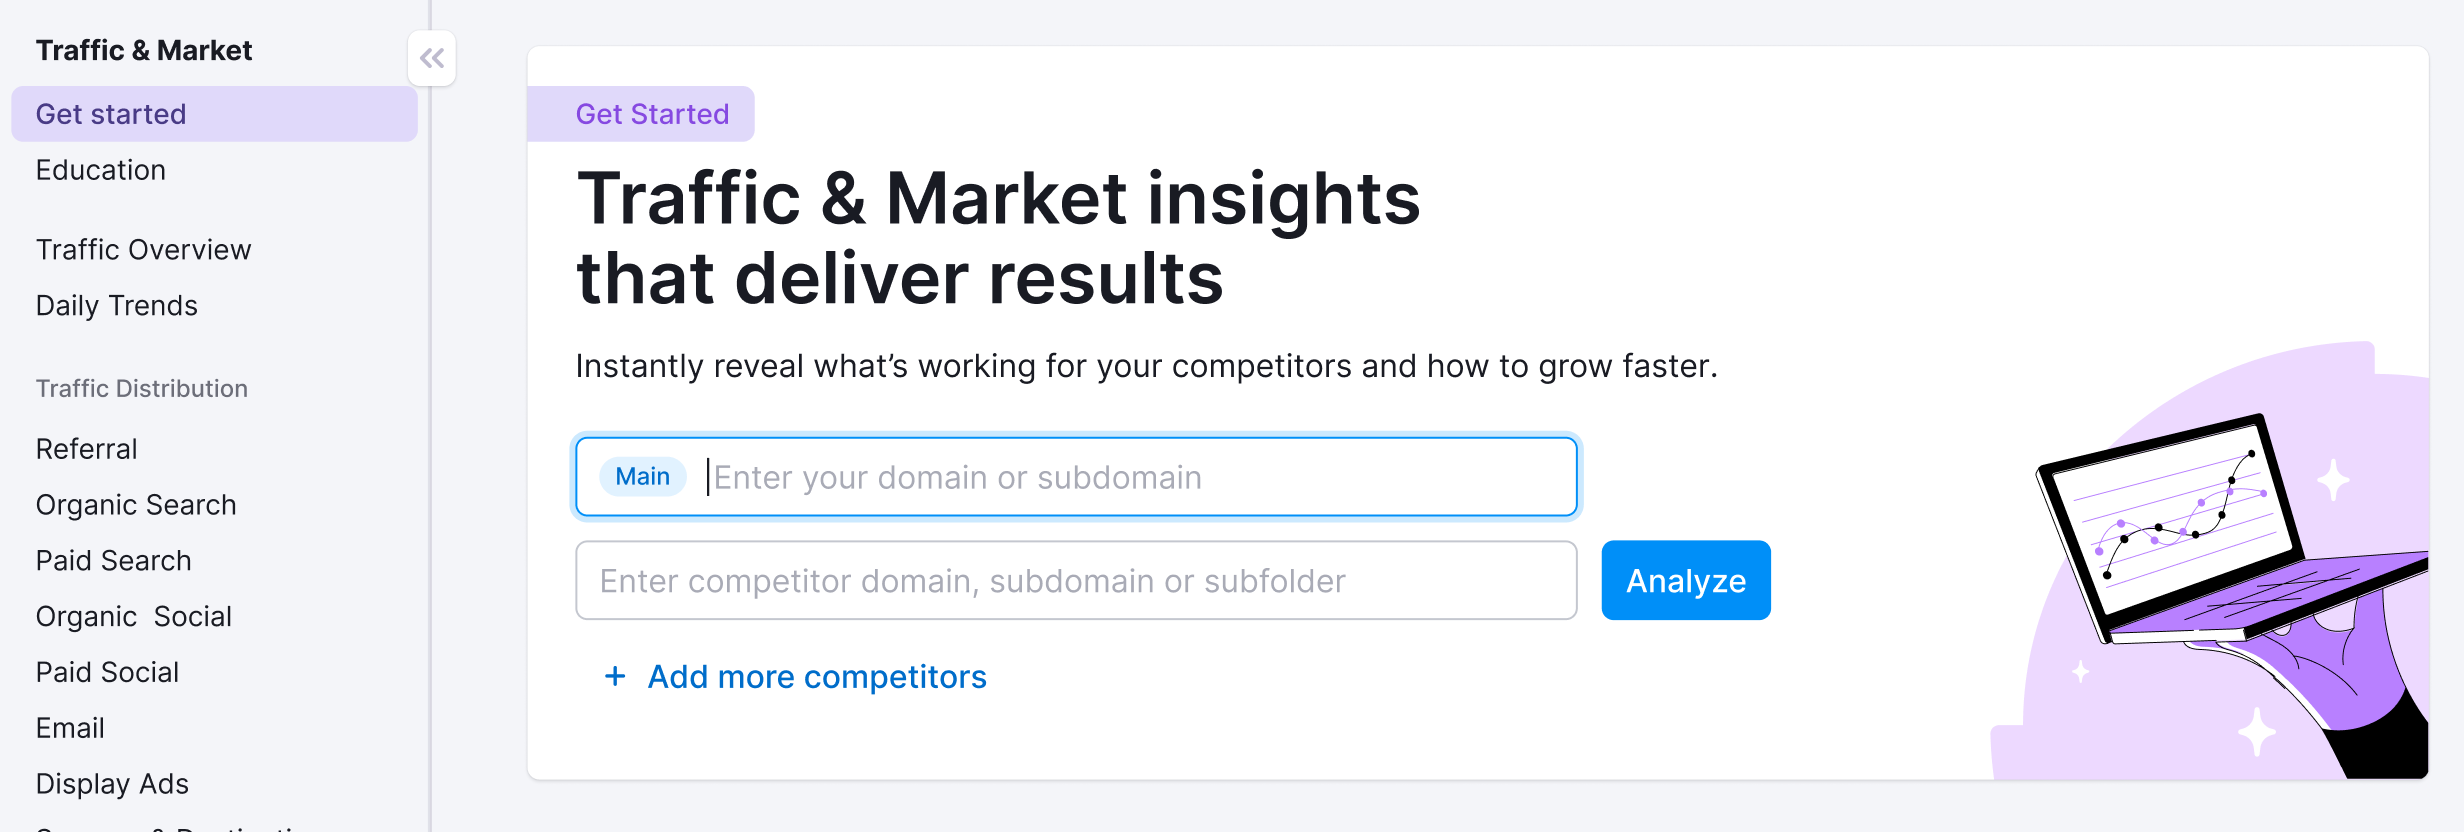
You’ll use this page to kick off your analysis—it’s your launchpad into the entire Traffic & Market experience.
If you haven’t created any projects yet, you’ll see a search panel where you can:
- Type in a domain — Start by entering the main domain you’d like to analyze
- Add additional competitors — Use the “+ Add more competitors” link to compare multiple sites at once
- Click the “Analyze” button — This will pull up dashboards with data and charts, starting with the Traffic Analytics dashboard
If you’ve already entered domains into the toolkit, you’ll see them saved as “Folders” and you can access them anytime.
In this case, you’ll see your saved folders listed on the Get Started screen. Click any one of them to jump straight into your dashboards and pick up right where you left off.
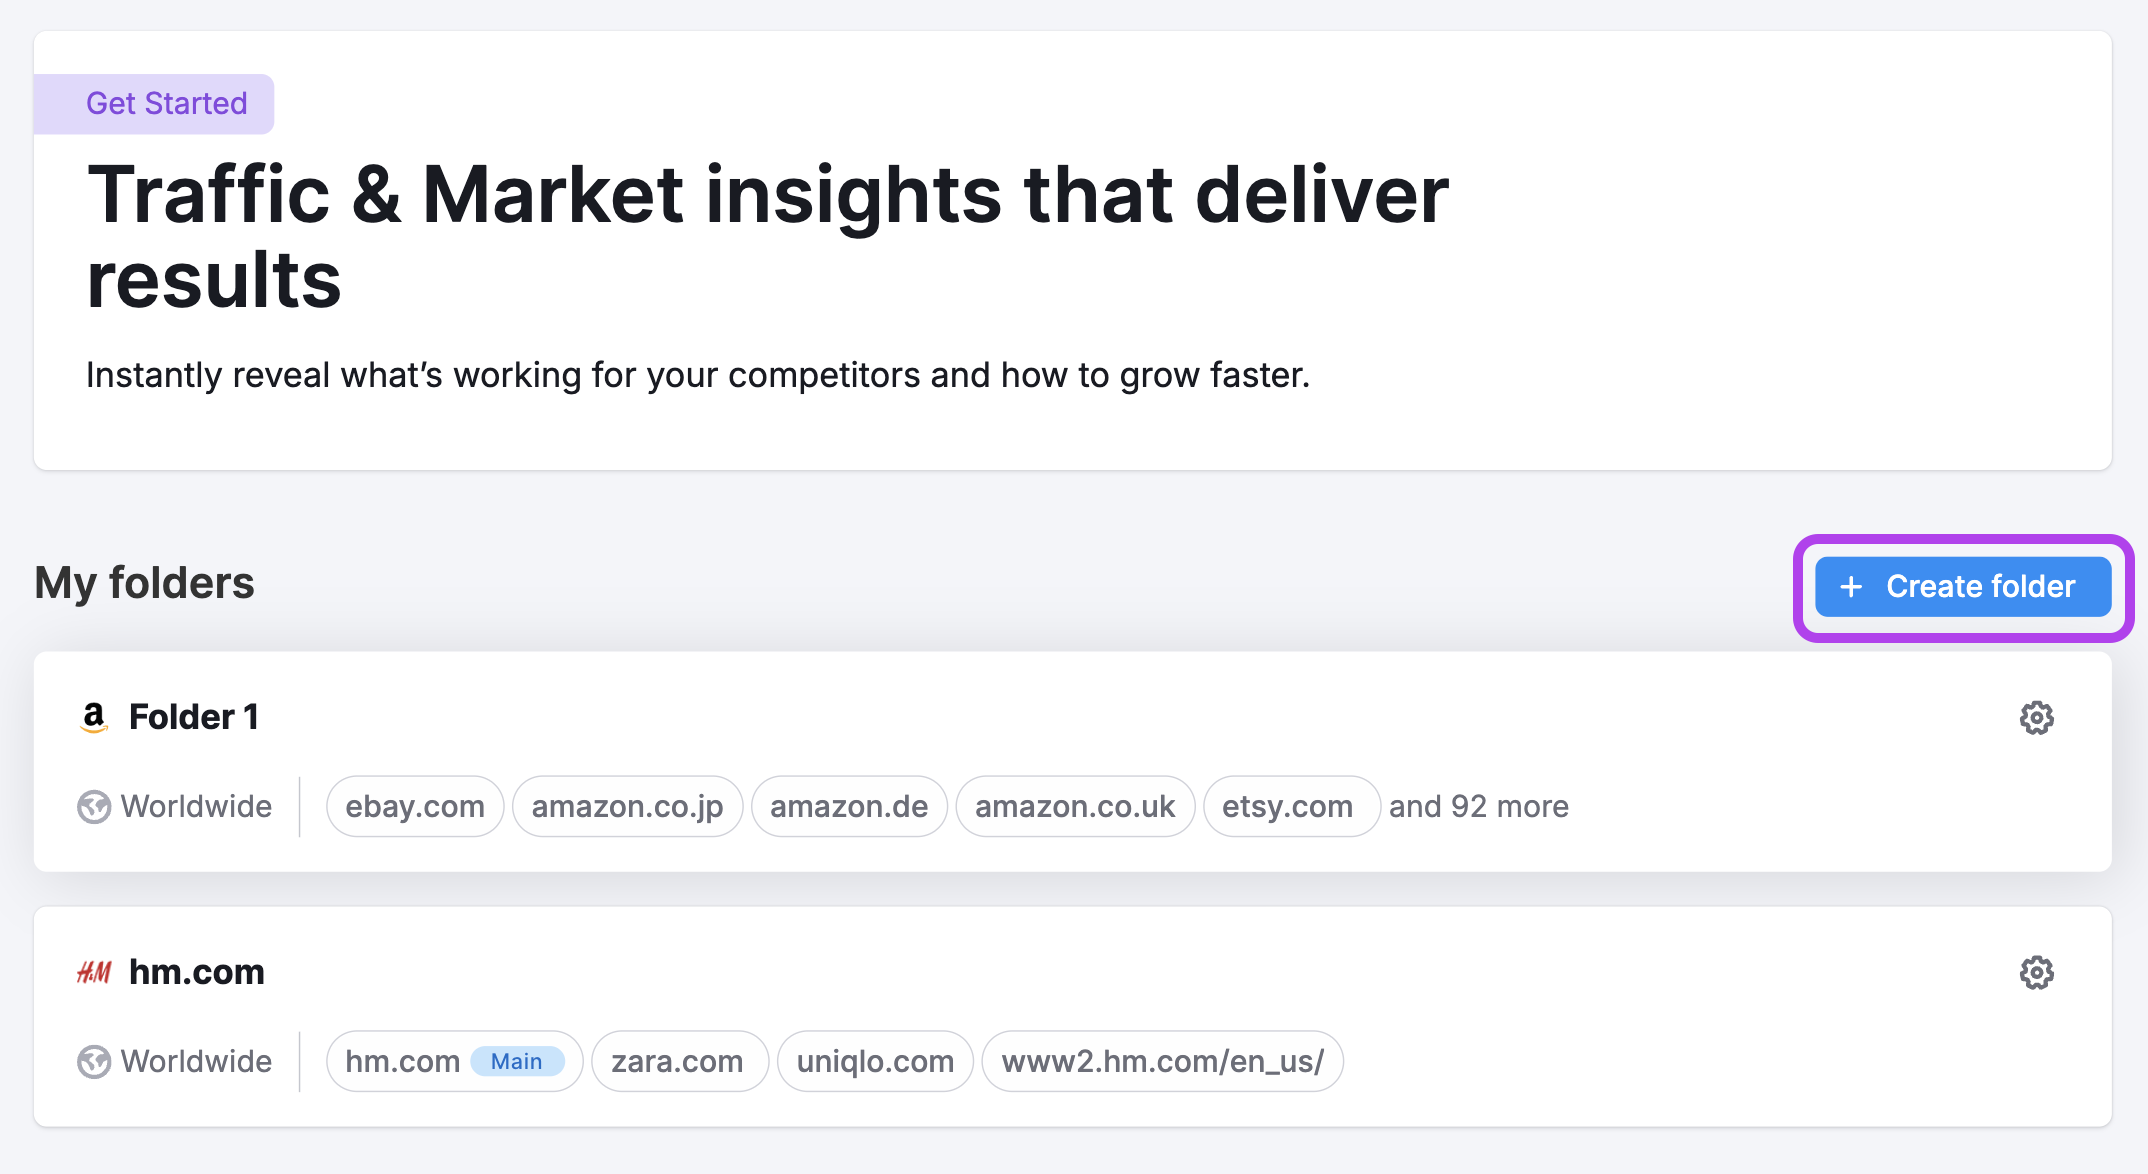
Use the “Create Folder” button to start a new project whenever you're analyzing a new domain or market.
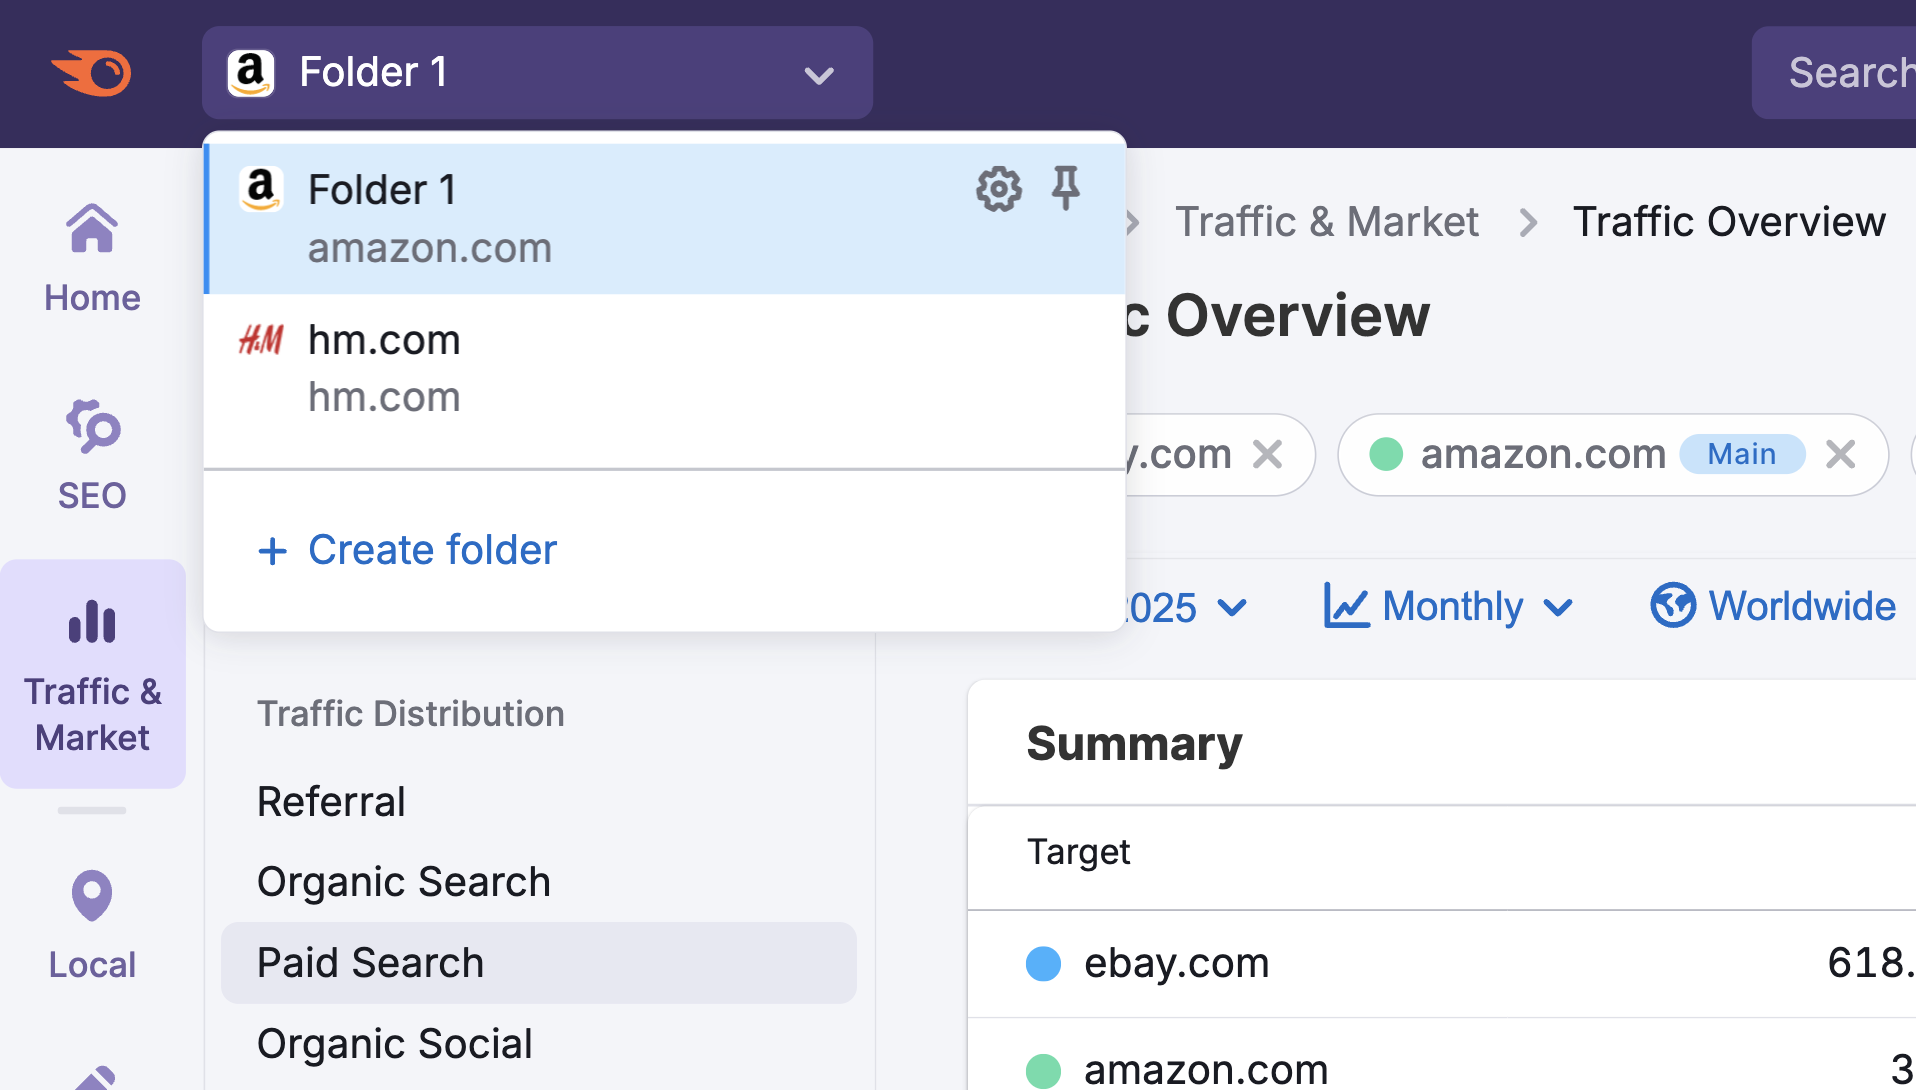
Note: At any time—no matter which dashboard you're on—you can click the Folders dropdown in the upper left corner of the dashboard to select another folder or add more competitors to your analysis without losing your place.
What dashboards and data will I find in the Regional Trends section?
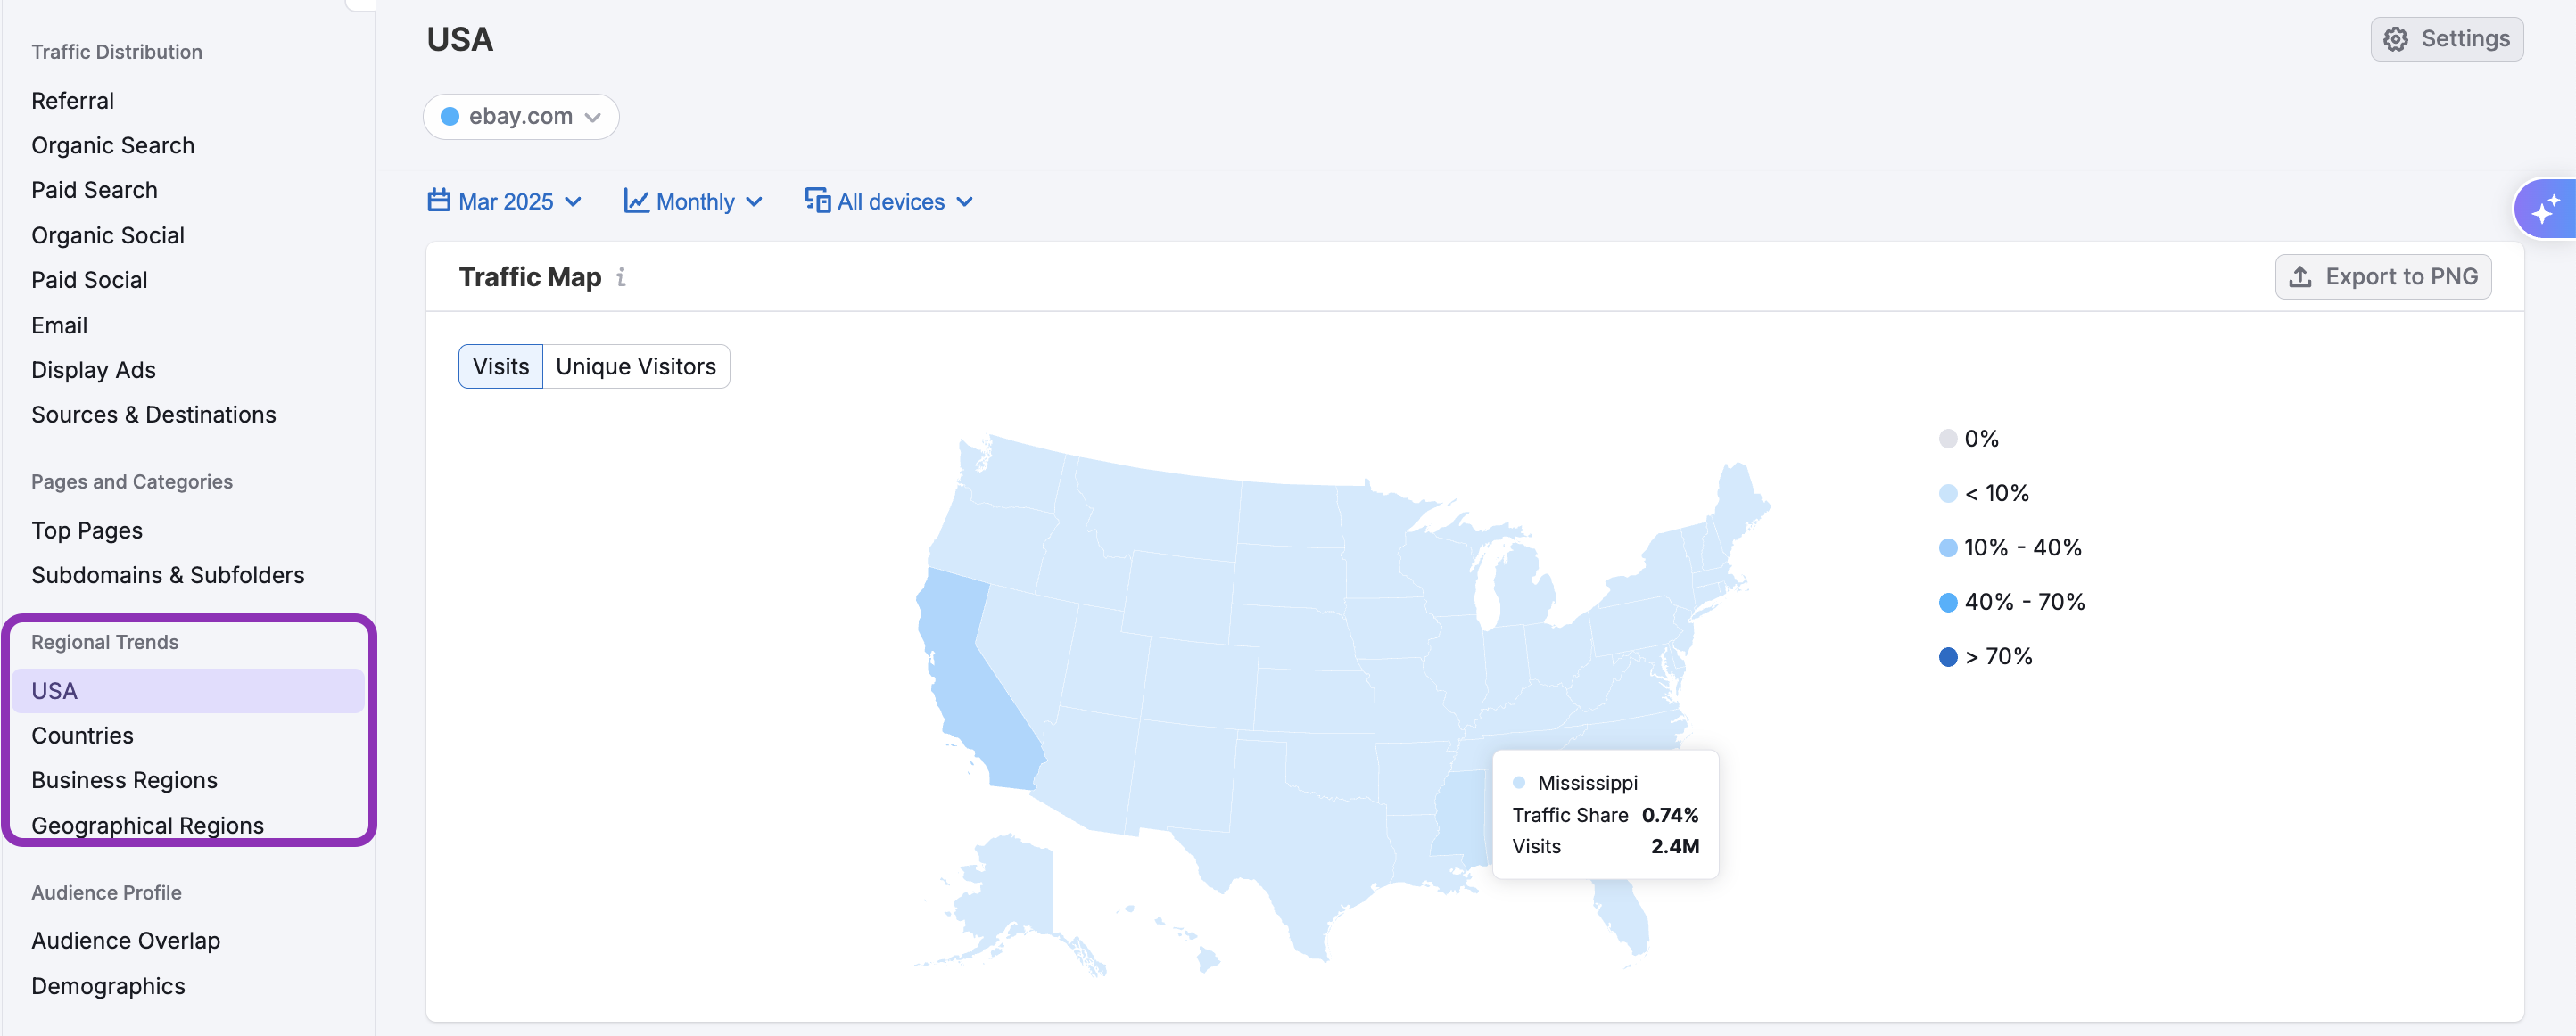
The Regional Trends section features four dashboards—each offering the same suite of powerful graphs to help you analyze traffic and market dynamics by geography:
What You’ll Find in Each Dashboard
Each dashboard gives you competitive intelligence to uncover where your competitors excel and to spot new opportunities for expansion. You’ll find:
- Traffic Map: See high-performing regions highlighted in darker blue, making it easy to prioritize areas for growth.
- Traffic Trend Chart: Track which locations are gaining or losing website traffic, so you can spot shifts in market dynamics.
- Traffic Tables (by State, Country, Business Region, or Geographical Region): Compare average session duration and bounce rates to identify the most engaged markets.
How the Dashboards Differ
- USA Dashboard: Focuses on traffic patterns within the United States, providing detailed data by state to inform your local marketing strategies.
- Countries Dashboard: Highlights global traffic patterns, showing traffic data by country to support your international marketing decisions.
- Geographical Regions Dashboard: Organizes traffic data by continent or subcontinent for a broader, high-level view of regional performance.
- Business Regions Dashboard: Groups data into major business regions—such as APAC, EMEA, or the Americas—making it easy to target and analyze larger market segments.
All four dashboards in the Regional Trends section offer the same core set of graphs and tables, letting you compare engagement, spot growth trends, and plan your expansion—no matter which U.S. state, region, or market segment you’re interested in.
Where does Semrush traffic data come from?
Traffic Analytics reports are based on petabytes of clickstream data that comes from multiple proprietary and 3rd party data sources, Semrush’s proprietary AI and machine learning algorithms, and Big Data technologies. The data is accumulated and approximated from the user behavior of over 200 million real internet users, and over a hundred different apps and browser extensions are used to collect it.
For more information about how Semrush turns traffic data into traffic intelligence, refer to our article here.
As Traffic Analytics data is not obtained from any website’s internal analytics, the numbers you see here might differ from what you see in your Google Analytics or similar trackers you use. However, if you want to analyze only your own website traffic without comparing it with others, we recommend that you refer to your own Google Analytics.
All numbers in Semrush Traffic Analytics are perfectly comparable, meaning you can match two or more websites in the tool and see how their metrics differ from each other in percentages.
What related Traffic & Market dashboards should I use?
To expand your analysis, pair the Regional Trends dashboards with:
- Traffic Analytics Dashboard – To get a high-level view of total visits, engagement metrics, and traffic sources across all channels over time
- Daily Trends Dashboard – To monitor short-term shifts in traffic and channel performance on a day-to-day basis
- Demographics Dashboard – To discover age and gender segments that drive the most traffic to a given domain