
Running a website without tracking its performance is like flying a plane without a navigation system. You won’t know if you’re headed in the right direction. Or where you should course-correct.
The right set of website metrics provides consistent feedback on what’s working and what isn't. So you can adapt. And hit your marketing goals.
Track these 24 website performance metrics to understand how well your website attracts, engages, and converts visitors.
What Are Website Metrics?
Website metrics are objective, data-based, numerical measurements of your website performance.
These metrics show how well your website attracts visitors, engages them with content, and converts them into customers. Some metrics measure technical aspects related to search engine optimization (SEO), page load time, and more.
The Importance of Website Metrics
Tracking website metrics helps you identify what works well.
For example, it can show you which sources bring in the most website traffic. Or what type of content converts. So you can do more of what works for your brand.
Website metrics also give you an unbiased view of how visitors and users interact with your website. For instance, a landing page with a high bounce rate could indicate that the content, experience, or design doesn’t resonate with users.
Lastly, website metrics offer an opportunity to understand your ideal users. They help you categorize website visitors based on geolocation, traffic source, and device. This can help you target more of them later on.
Here’s an example of data from Google Analytics showing users by device:
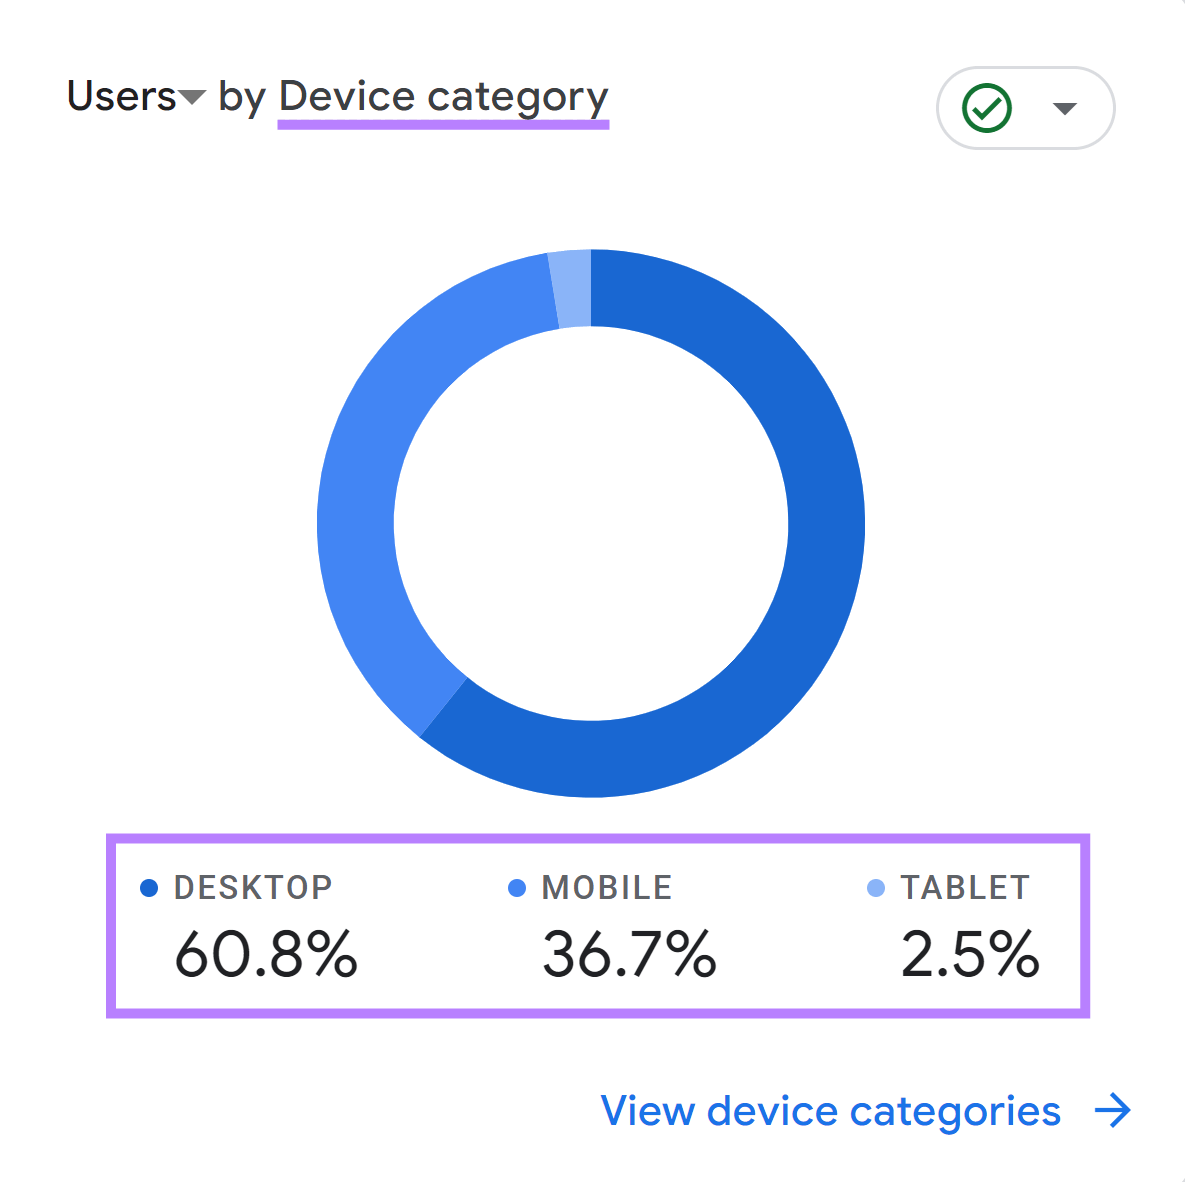
From multiple data points, you could learn that most of your ideal users are from the U.S., arrive on your website organically via Google.com, and use a mobile phone. From there, you can fine-tune your website content and design to serve this target audience better.
Evolution of Website Metrics in the Digital Age
In the 1990s, websites were scrappy, hyperlink-based sites. And their efficacy was measured by two metrics introduced in the mid-90s: page views and visits. That’s all.
Today’s websites are highly personalized, interactive, lead-generating assets—central to our marketing efforts.
They have advanced to:
- Compete with other online offerings
- Serve more users (global online users grew from .05% in 1990 to 66.2% today)
- Interact with users via 3D elements, animations, chatbots, motion sensors, search features, social media, videos, virtual reality (VR) and augmented reality (AR)
If the early websites were comparable to a Ford Model T, today’s websites are akin to self-driving cars that run on better roads, at higher speeds, with more features.
They must be measured differently. We need a range of detailed website metrics to help us identify our opportunities to stand out from the competition.
How to Check Website Metrics
Tools like Google Analytics and Semrush provide you with comprehensive website analytics metrics.
For example:
Google Analytics reveals how users interact with your website, how long they stay, and which pages they visit.
Semrush’s Traffic Analytics tool does that too, while Domain Overview tracks a site’s performance over time, Organic Traffic Insights reveals engagement by keyword, and Site Audit reports on the technical performance of your site.
Below, we’ll consider seven categories of website metrics. And within each one, recommend specific metrics to measure.
Website Traffic Metrics
Website traffic metrics have to do with the visitors who use your website.
The following four website traffic metrics can help you understand how many visitors you get each month, where they come from, and what content they consume.
1. Total Number of Visits
This metric tells you the total number of times your website was visited during a specified period: monthly, quarterly, or annually.
The ideal number of website visits will vary depending on your offering, industry, and target audience. For instance, an online B2C (business-to-consumer) brand may view 1 million monthly visits as inadequate because it’s focused on high-volume sales. But for a niche B2B (business-to-business) SaaS product, even 10,000 monthly visitors can be valuable because it focuses on lower-volume but higher-quality leads.
2. Total Unique Visitors
Let’s say two users, A and B, visited your website in the last hour. User A visits your website once. But user B visits your website twice. In this case, the total number of visits is three, but the unique visitors count is two.
Unique visitors are the actual number of people you reached. Use the following formula to find the average number of visits per unique visitor.
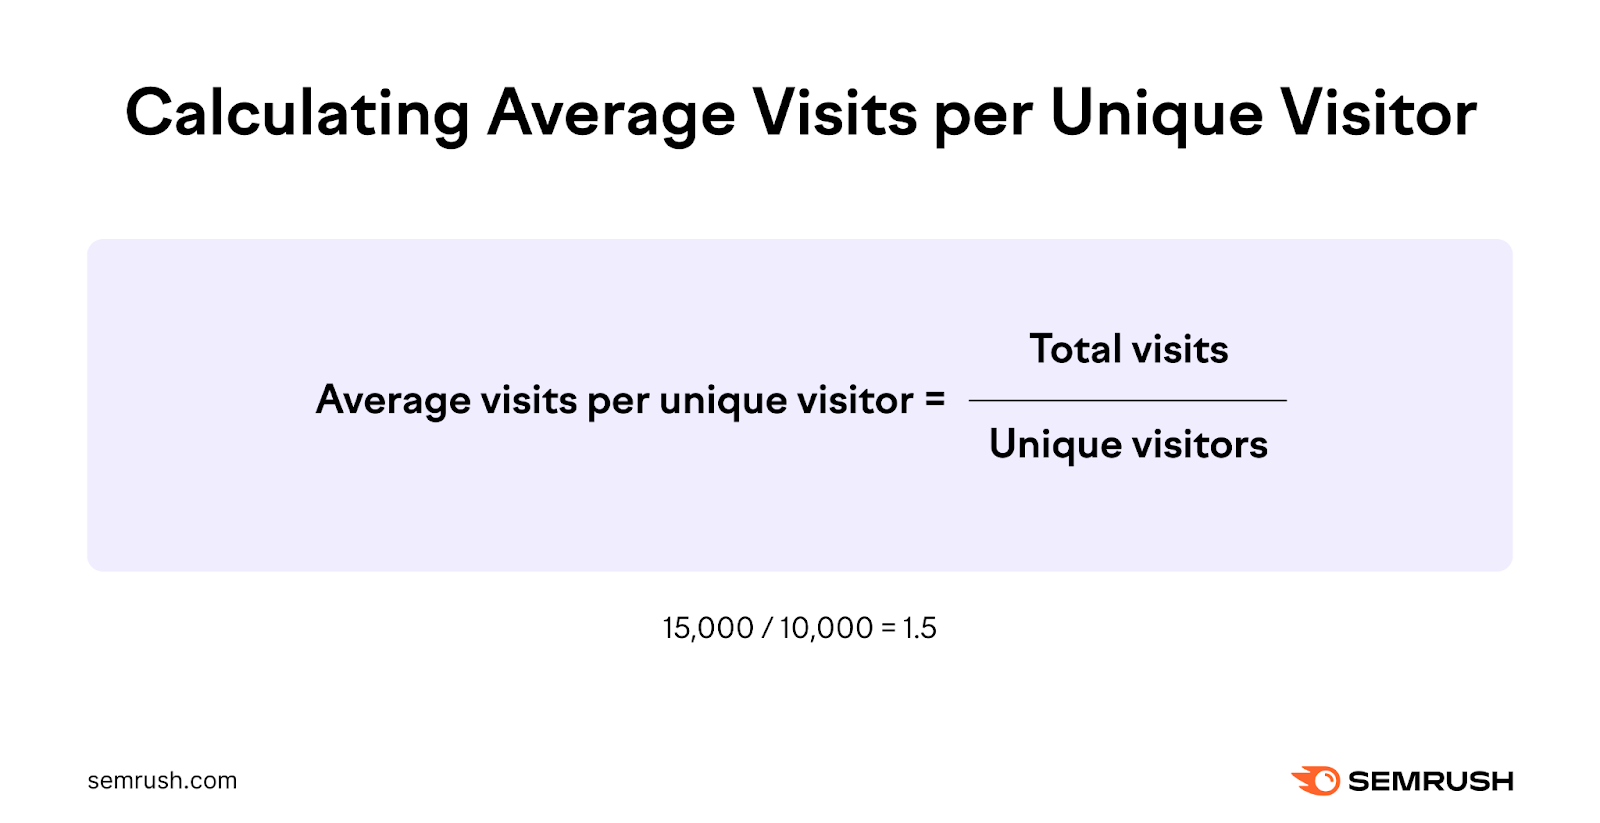
If your website received 15,000 total visits and 10,000 unique visitors last month, your average visits per unique visitor is 1.5.
3. Traffic Sources
Traffic sources reveal how visitors arrive on your website.
For example, see if site visitors came from search, a link in an email, a referral link, paid ads, or social media.
Identifying your site’s top traffic sources helps you focus your marketing and sales efforts on channels that bring in the most visitors.
4. Page Views
This metric shows the total number of times any of your webpages loaded in a browser. So, even repeated page loads by the same user are counted.
Advanced tools may also show a unique page view metric that counts only unique user page views.
Track the above four website traffic metrics with a free Google Analytics account. Or, use Semrush Traffic Analytics to go one step further. It compares your traffic metrics with your competitors’. And gives suggestions on how to attract more traffic.
To start, log in to Traffic Analytics.
And enter the domains of up to five competitors.
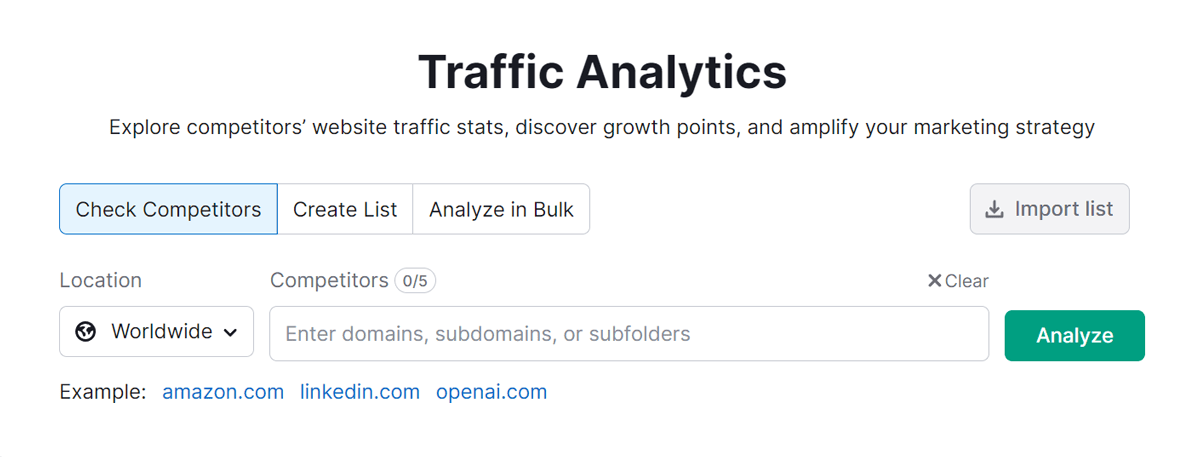
Select a location from the drop-down. Then, click “Analyze.”
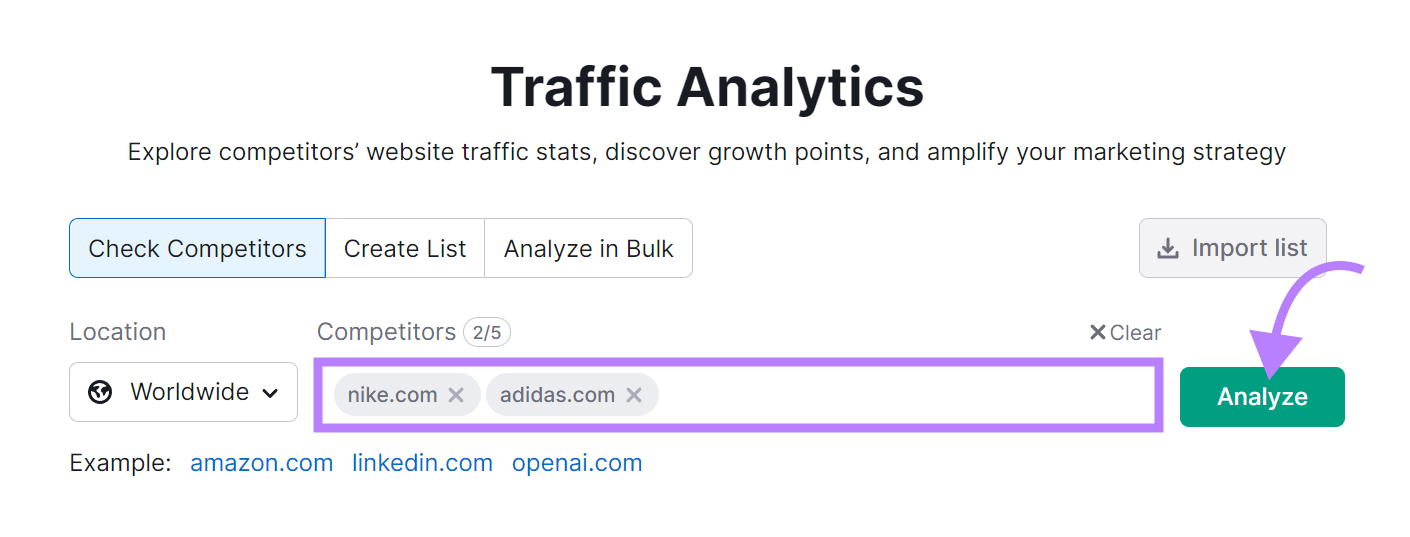
In this example, we’re using Nike and Adidas as competitors for our fictional shoe brand.
You’ll see a dashboard similar to the one shown below.
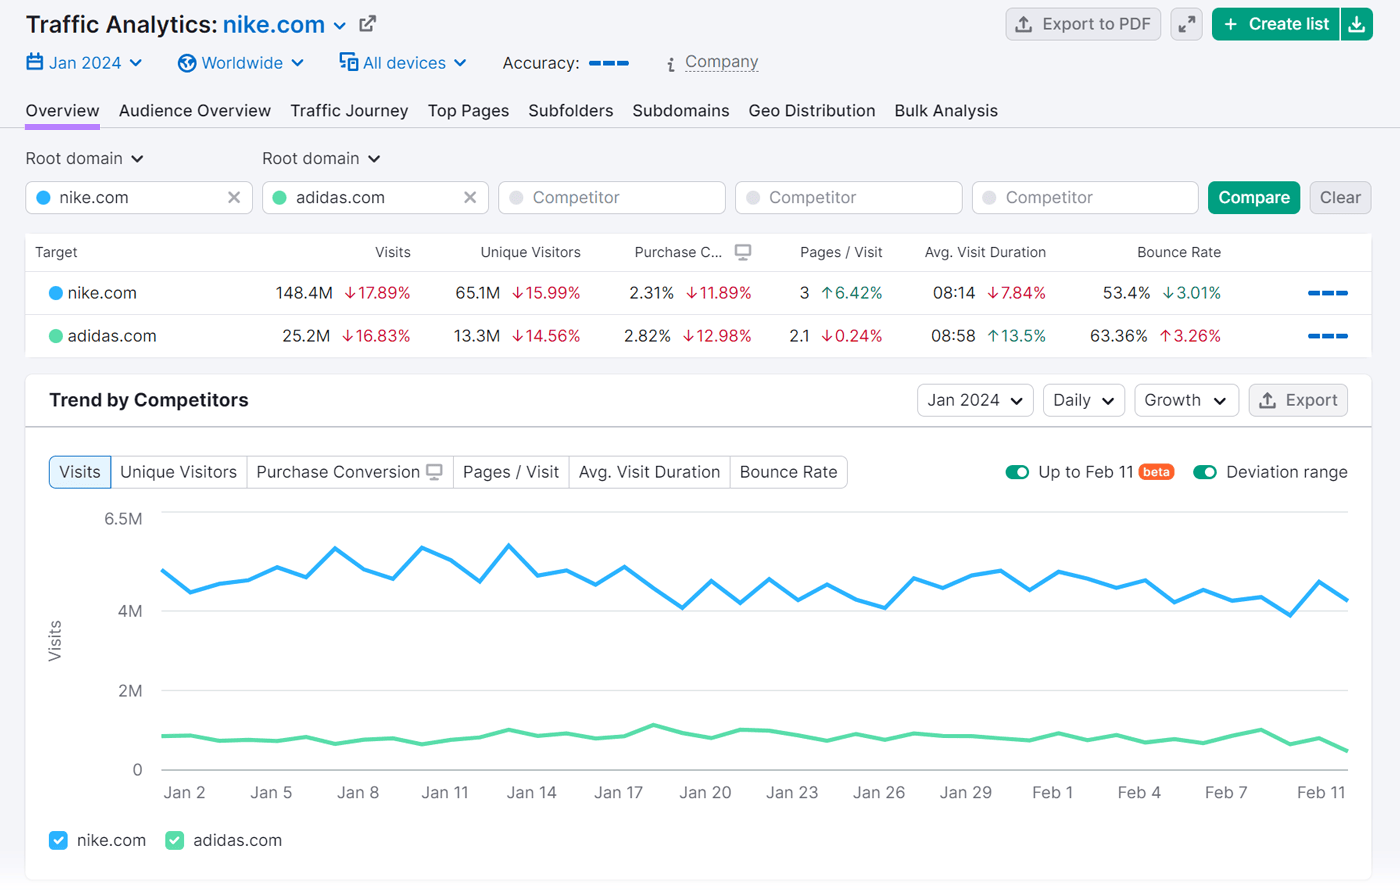
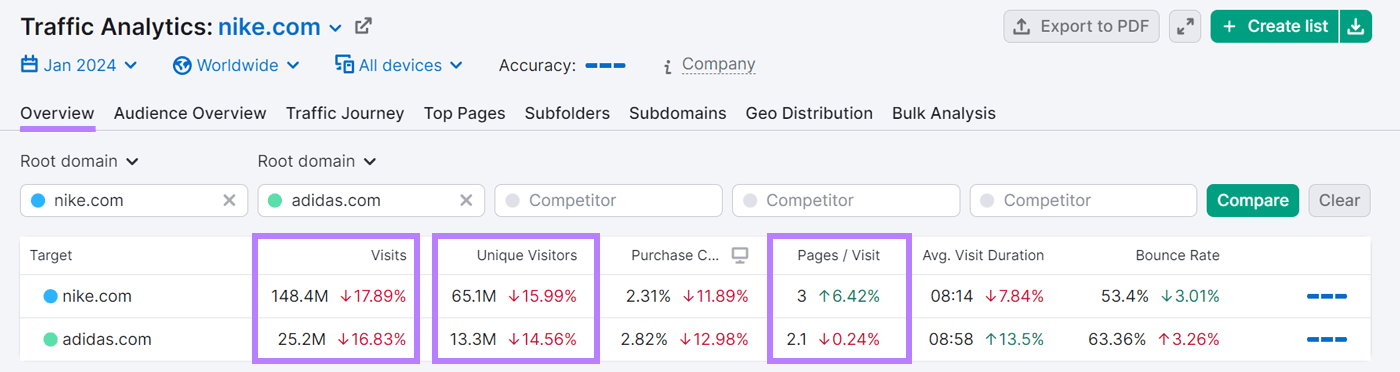
The “Overview” tab shows three of the four traffic-related metrics:
- Total number of visits
- Unique visitors
- Page views per visit
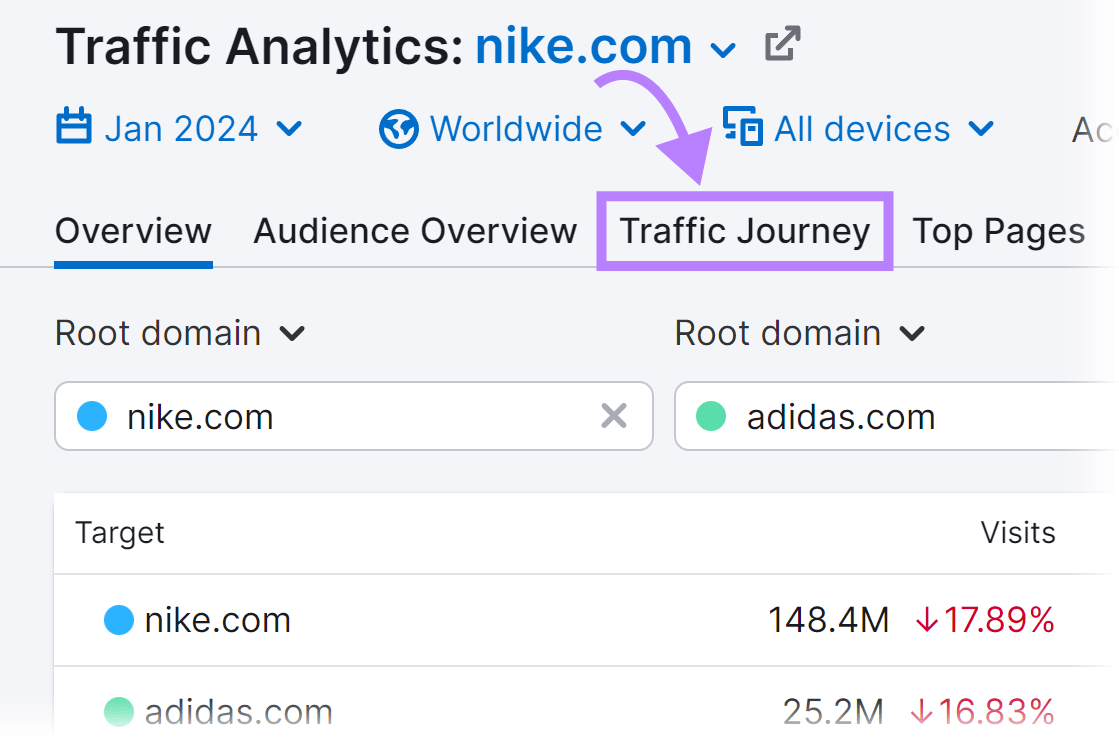
To find details on the fourth metric, traffic sources, click “Traffic Journey.”
You’ll see Traffic Channels.
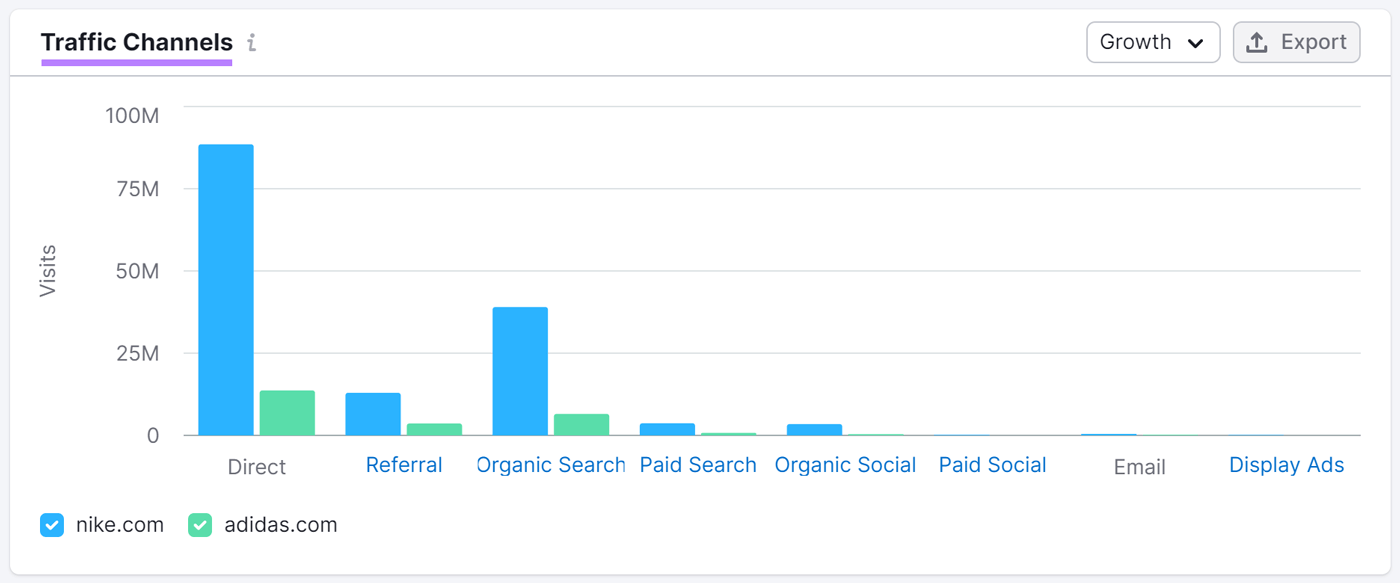
Below that, you’ll see “Traffic Journey.”
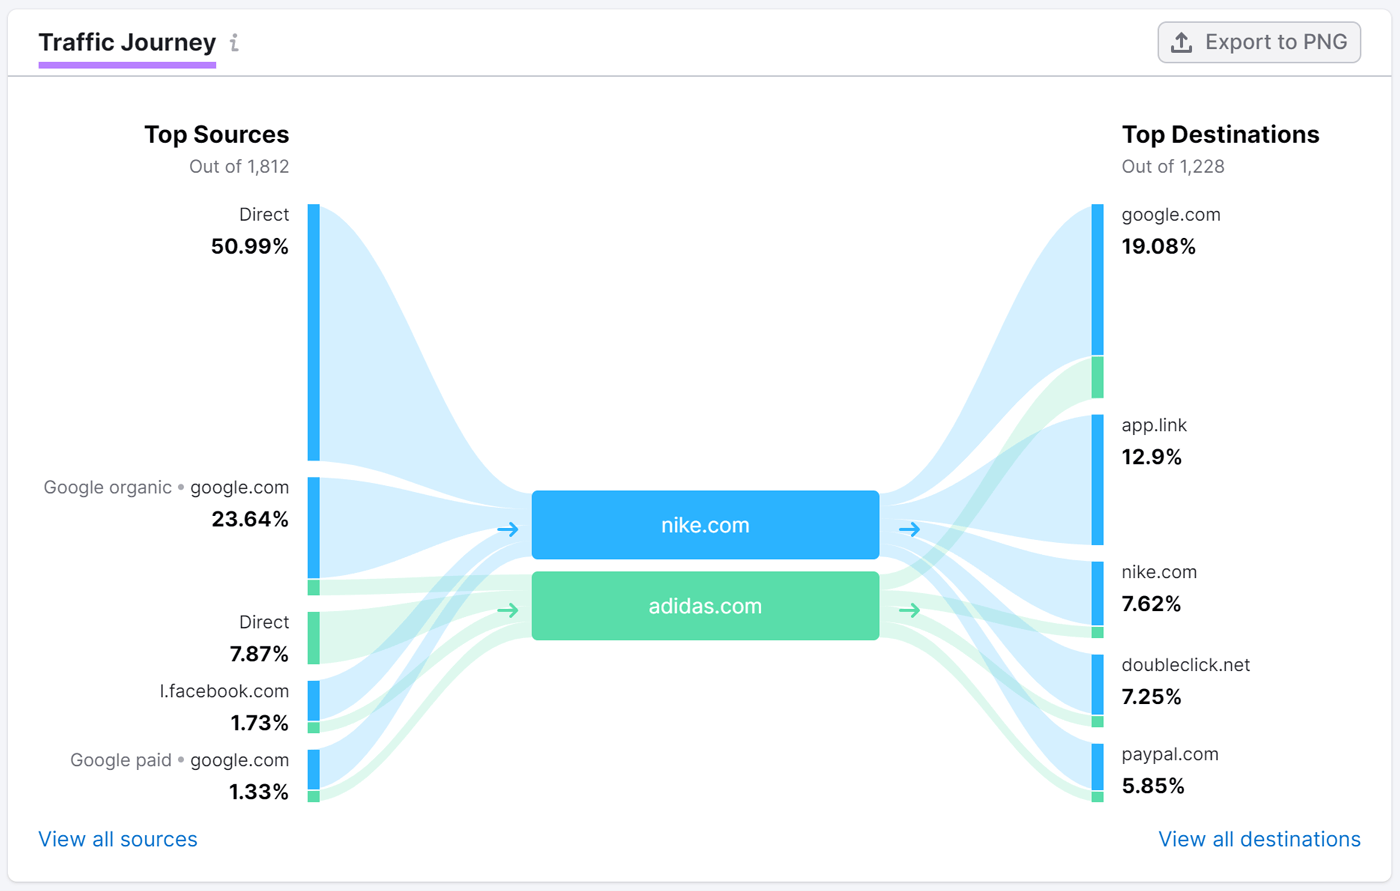
With this information, identify opportunities to replicate and improve on your competitors’ success.
In our example, both Nike and Adidas have traffic from Facebook. Facebook may be a good place to advertise and reach the target audience.
Engagement Metrics
Engagement metrics reveal how users interact with your site.
Four to review are:
5. Average Session Duration
This metric tells you the average time visitors spend across your website before their session ends.
A longer average session is more desirable. But your metrics will vary depending on your industry. The average session duration for B2C websites is 92.33 seconds. For B2B, it’s slightly lower at 77.61 seconds.
If your average is above that, your site is doing well.
6. Pages Per Session
This metric tells you the average number of webpages visitors view during a session. For more context, this metric is often shown alongside the average session duration metric.
“The median number of pages per session for B2B companies is 1.89” according to Databox. So, two or more pages per session is highly desirable. If your pages per session metric is less than two, revisit your content strategy, website design, and ideal customer profile.
7. Bounce Rate
Bounce rate measures the number of sessions that lasted fewer than 10 seconds, led to no conversions, and had fewer than two page views.
It’s reported as a percentage of all visitor sessions. The following formula helps you calculate your bounce rate:
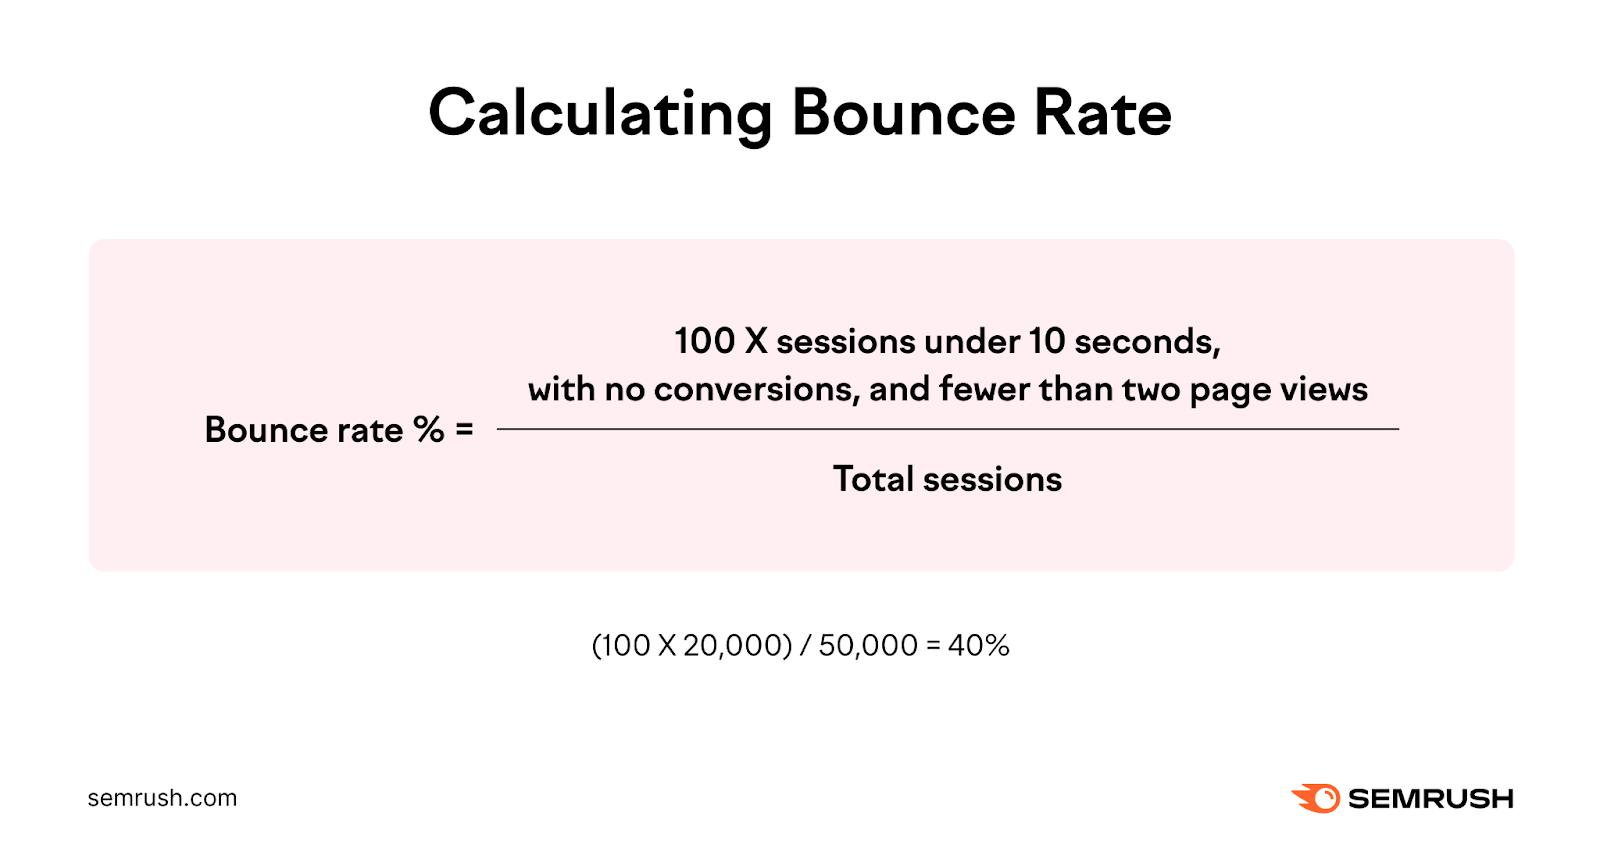
Let’s say your total number of monthly sessions is 50,000. In 20,000 of those sessions, visitors exit your website without viewing another webpage, completing a conversion, or staying for at least 10 seconds. Your bounce rate would be (100 X 20,000) divided by 50,000 = 40%. A bounce rate of under 40% is good.
8. User Behavior Flow
The user behavior flow is shown as a sankey chart. This chart shows how visitors navigate to other pages on your website.
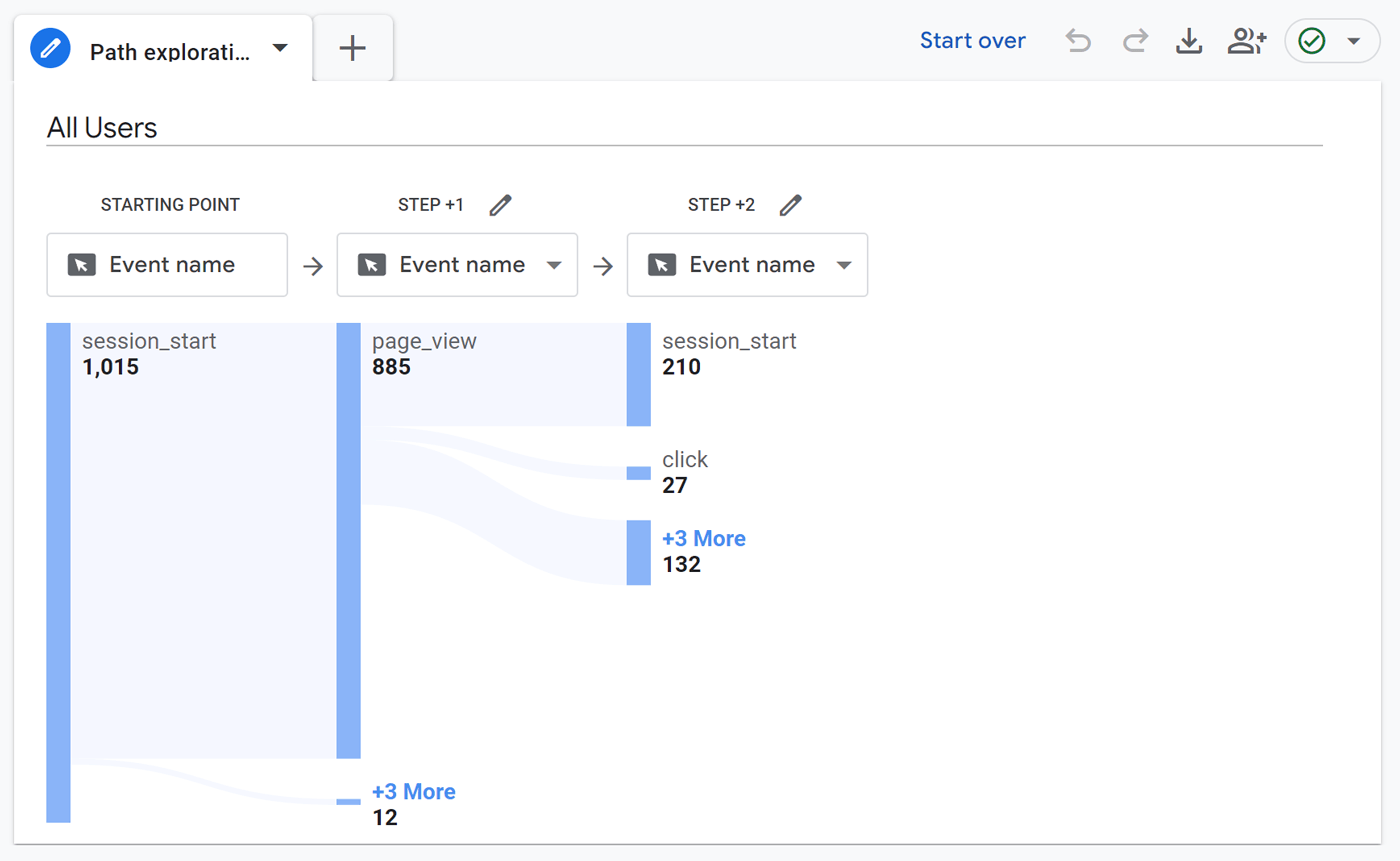
This chart helps you visualize the order visitors go in as they move between your various webpages. It also identifies the pages where visitors commonly drop off.
Use this information to improve your site design or create more engaging content.
Track these four website engagement metrics with a free Google Analytics account. Or use Semrush’s Organic Traffic Insights for a more detailed analysis.
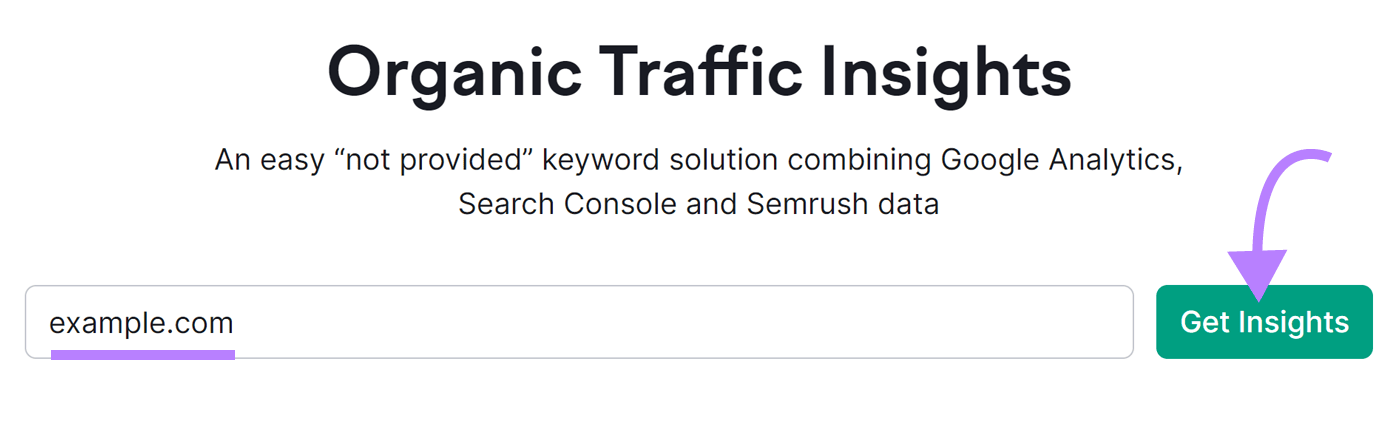
Log in to Organic Traffic Insights.
Enter your domain and click “Get Insights.”
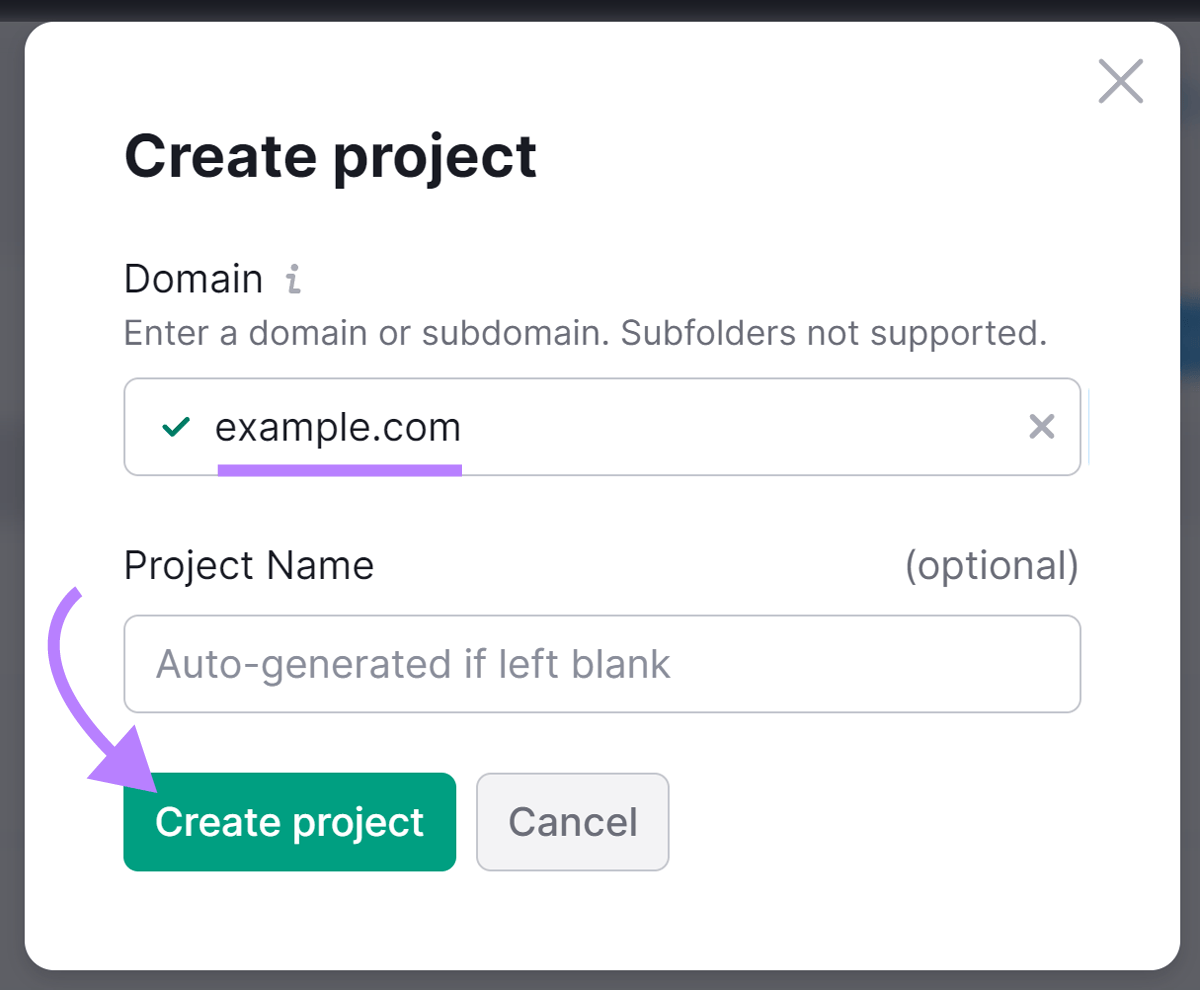
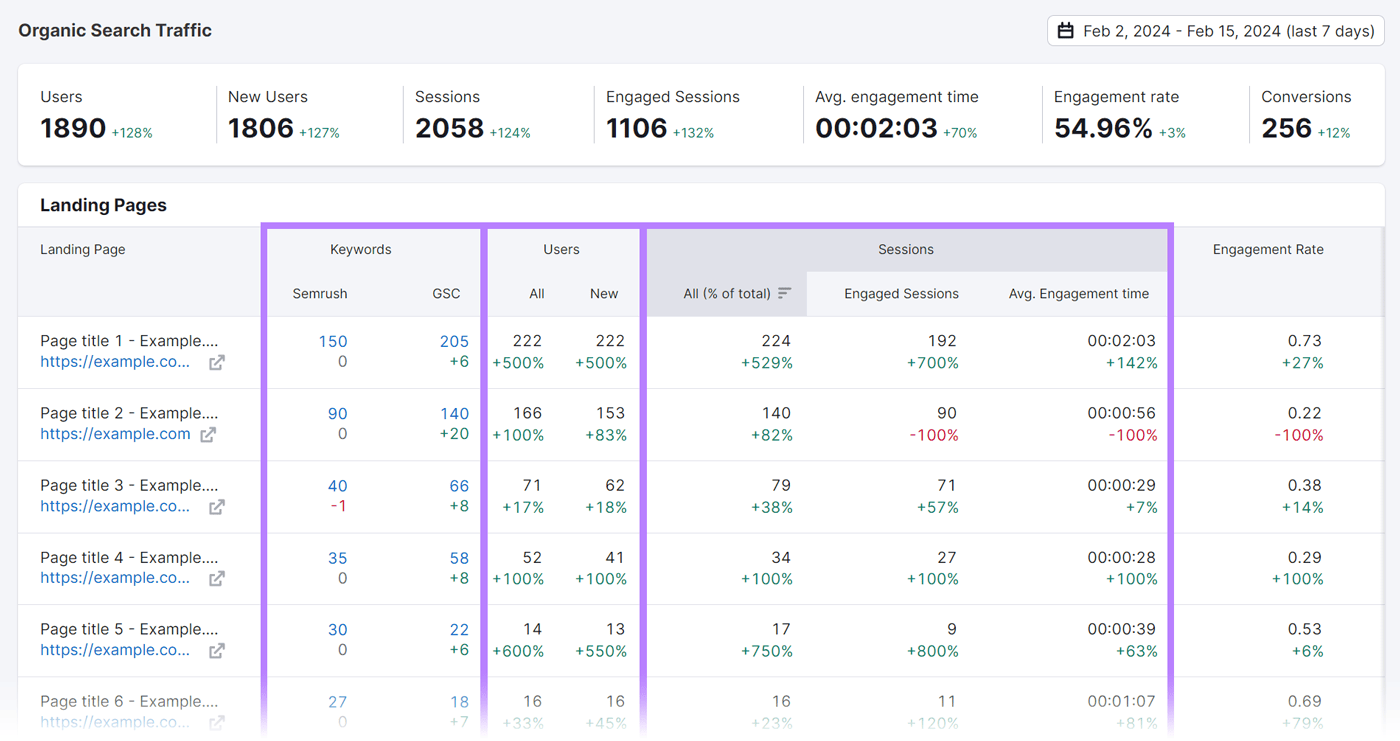
Once you set up a project, click the project name to see metrics about its keywords, users, and sessions.
Conversion Metrics
Conversion metrics help you understand how well your site is driving action.
Calculate the effectiveness of your conversion and sales funnels with these three conversion metrics.
9. Conversion Rate
This metric tells you what percentage of visitors performed a predefined conversion action, such as subscribing to your blog, downloading a PDF, or purchasing your product.
Define the most appropriate conversion action to measure based on your website goals. For example, if you’re running marketing campaigns designed to generate leads, measure the conversion rate on your form submissions.
Whatever you’re measuring, the conversion rate formula is:
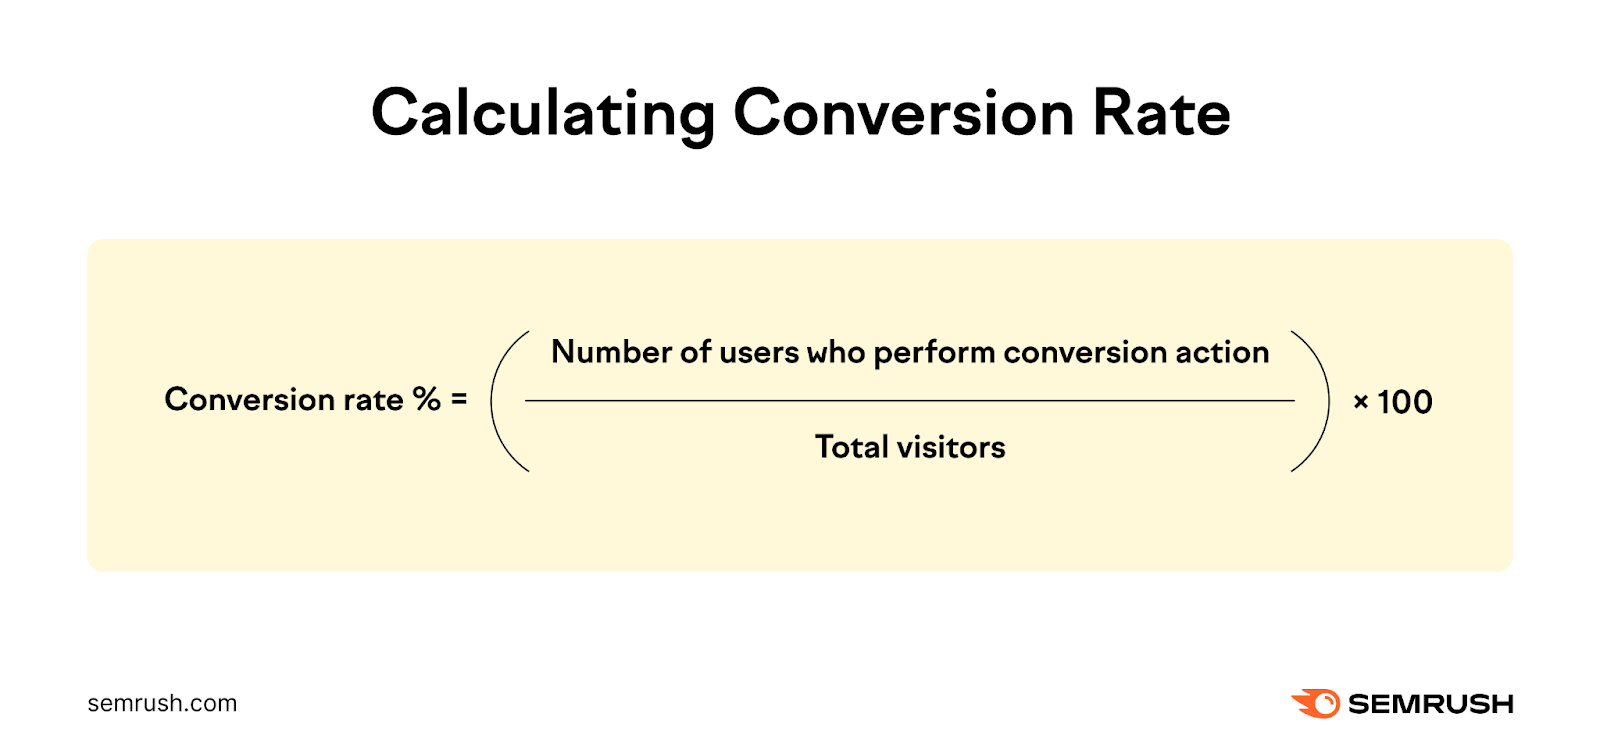
If 10,000 total visitors view your landing page and 5,000 submit the form, your conversion rate will be 5,000 form submissions divided by 10,000 visitors (= 0.5) multiplied by 100 (= 50). That’s a 50% conversion rate.
10. Cost Per Conversion
This metric shows how much it costs a company, on average, to convince a user to perform the conversion action.
To calculate this metric, divide the total conversion campaign cost by the number of users who performed the conversion action.
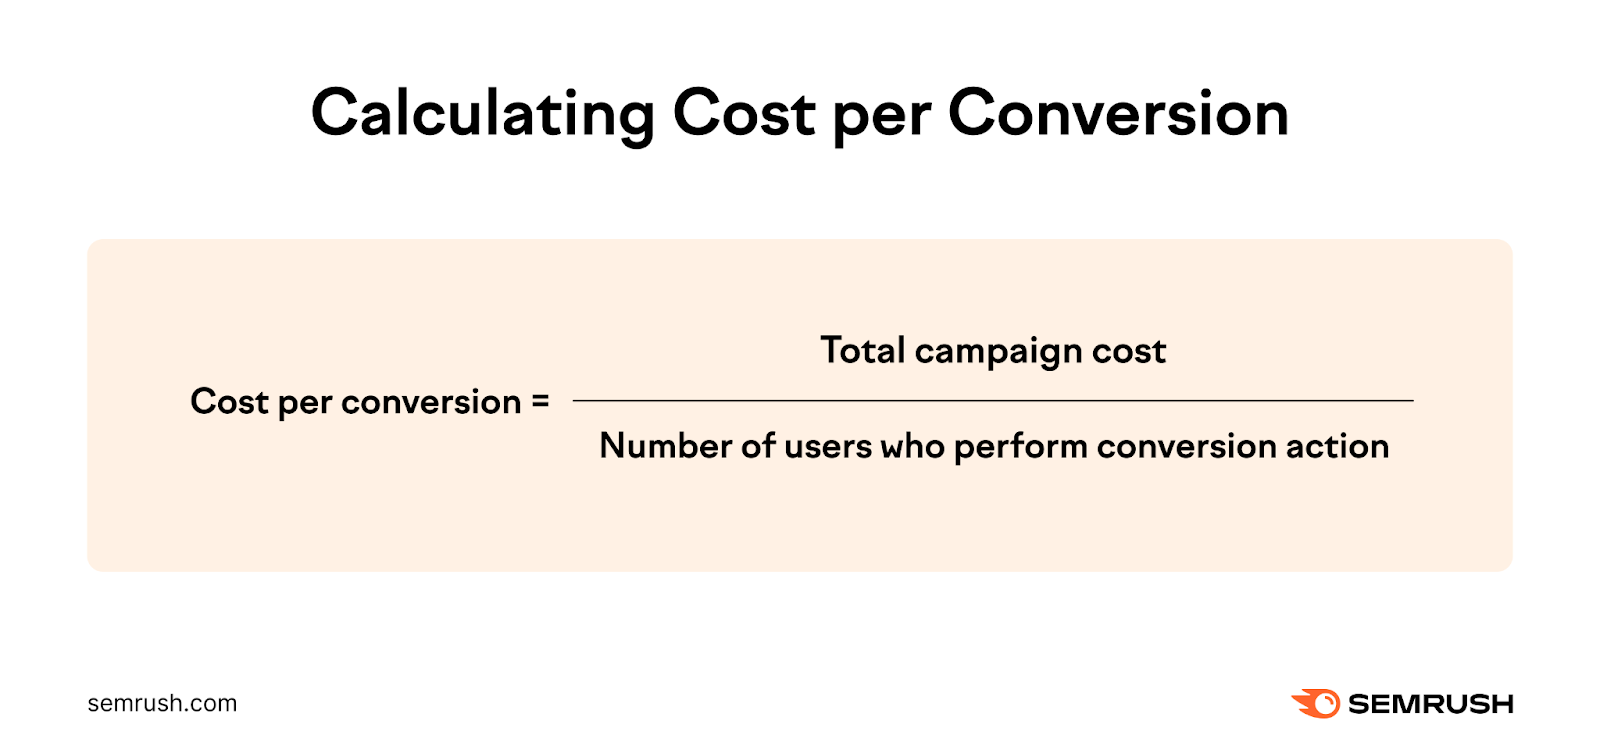
For example, if you paid $10,000 (total campaign cost) to create social media assets and ads, and you get 50,000 visitors who perform the conversion action (submitting a form), your cost per conversion will be $10,000 divided by 50,000 conversions = 20 cents per conversion.
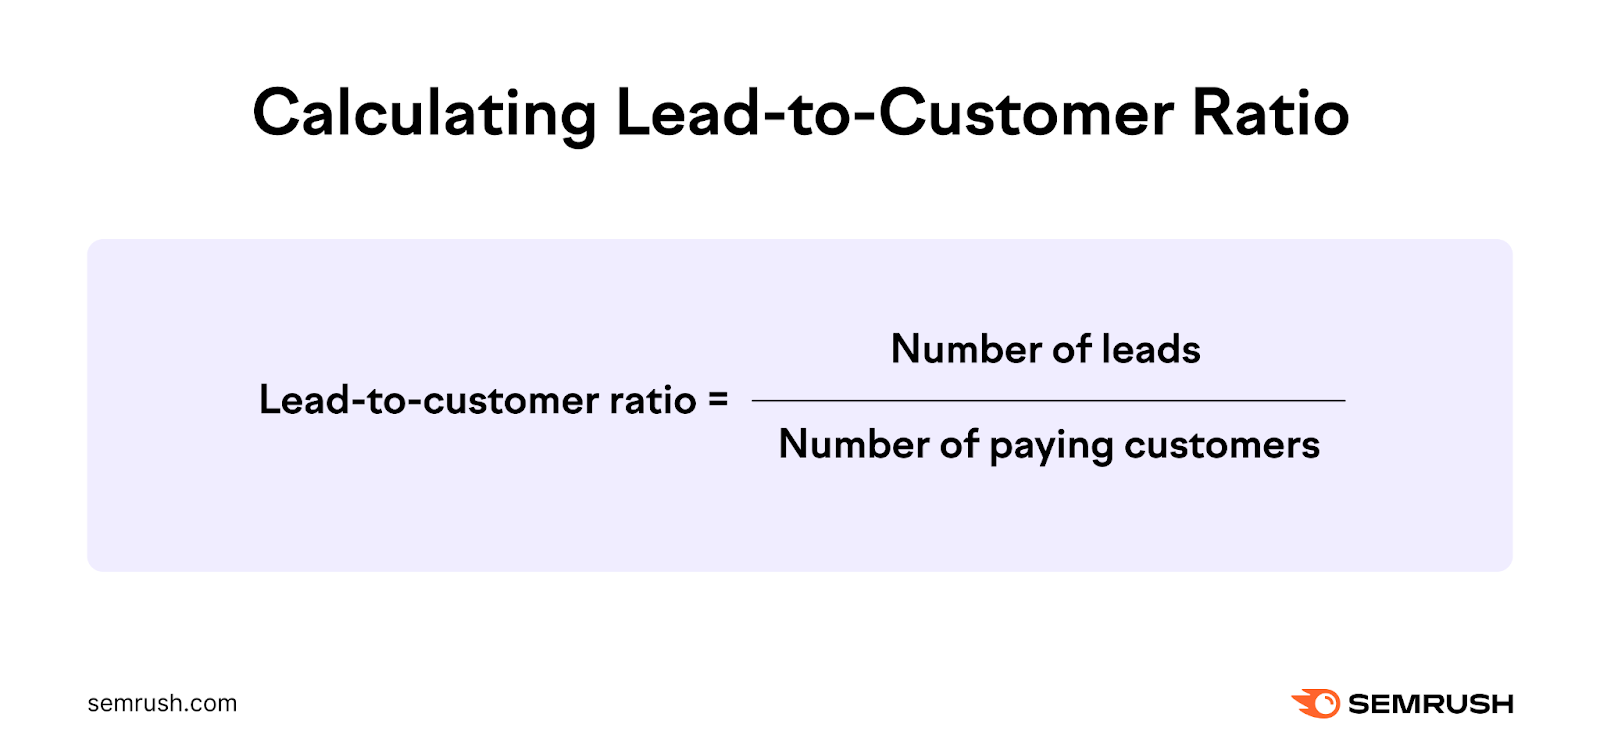
11. Lead-to-Customer Ratio
This metric tells you how many leads you need, on average, to earn one paying customer.
To calculate this metric, divide your total number of leads by your total customers. Set parameters based on the question you want to answer.
For example, you could calculate leads and customers from:
- A certain time period
- A specific campaign
- A particular sales region
For example, if a marketing campaign generated 1,000 leads and 200 became paying customers within 90 days of its deployment, your lead-to-conversion ratio for that campaign would be 1,000 leads divided by 200 customers = five leads per customer.
Businesses with long sales cycles and large average purchases may substitute leads with qualified leads. A qualified lead is a person or company that fits the business’s ideal customer profile (ICP) and has intent to purchase.
So, the above example of 1,000 leads will undergo another qualification step. Let’s say that only 500 of these leads meet the qualifying criteria. In this case, the lead-to-customer ratio would be 2.5 leads per customer.
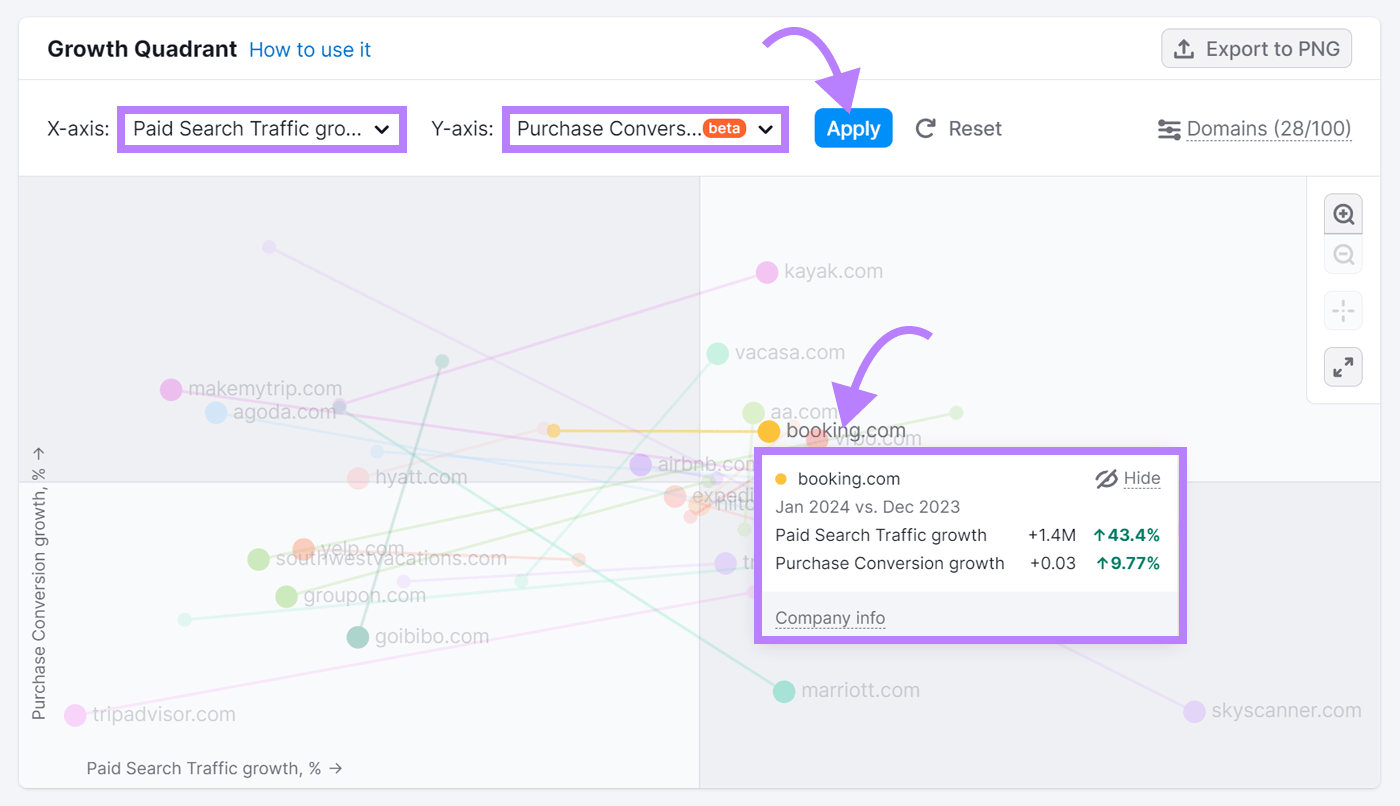
A free tool like Google Analytics can help you track these conversion metrics. Or use Semrush’s AI feature to analyze competitor purchase conversion trends. This helps you identify effective conversion strategies from your competitors.
SEO Metrics
SEO metrics measure how visible your site is likely to be in organic search results.
Use the following four SEO metrics to understand your website’s performance in search. And how to improve its online presence.
12. Keyword Rankings
When someone conducts an internet search using terms that are relevant to your business, where your URL appears in the search engine results pages (SERPS) is your keyword ranking for that term.
For example, if your website is in the third position on Google’s search results page for a particular keyword, your keyword ranking is three.
You’ll have different keyword rankings for each keyword. Ideally, you’d want to rank highly for as many relevant keywords as possible.
For example, if your website sells CRM software, you’ll want to rank highly for several high-value keywords such as “what is a CRM,” “CRM pricing,” and “salesforce alternatives.”
13. Organic Traffic
Search results can include both paid and unpaid results. Organic results and ads.
The organic traffic metric tells you the number of visitors who arrive on your site specifically from unpaid or unpromoted search results. It accounts for all the free traffic you attract by creating relevant and insightful content for your target audience.
Visitors that come from paid search ads don’t count as organic traffic.
14. Backlinks
Backlinks (or inbound links) are links on other websites that point to your website.
Let’s say a customer leaves a positive review of your SaaS product on a product review site like Trustpilot or G2. And that review contains a link to your homepage. That counts as a backlink.
Ideally, you’d want to encourage as many backlinks as possible by asking your customers, partners, and vendors for public reviews and testimonials. You also earn backlinks by creating free offerings, original research, and remarkable user experiences that experts and influencers in your industry want to talk about.
15. Click-Through Rate (CTR)
This metric tells you what percentage of people clicked on your link out of everyone who saw it. It can help you determine how many impressions you need to earn a click.
Calculate the CTR using this formula:
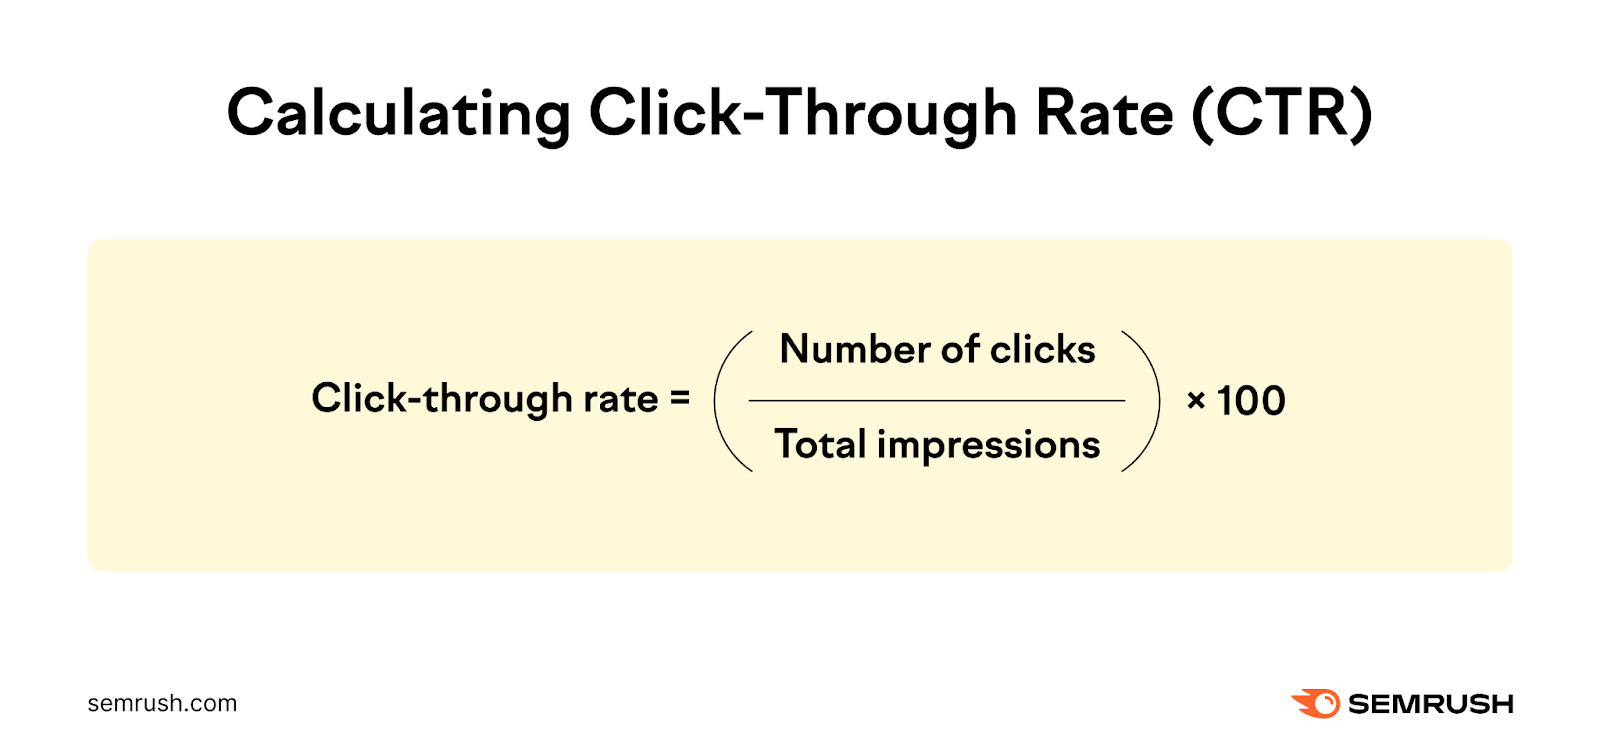
Let’s say you run an ad campaign highlighting an original research statistic from your company data. If 10,000 users saw this ad and 1,000 clicked the CTA button, your CTR is 1,000 clicks divided by 10,000 impressions (= 0.1) x 100 (= 10). Your CTR is 10%.
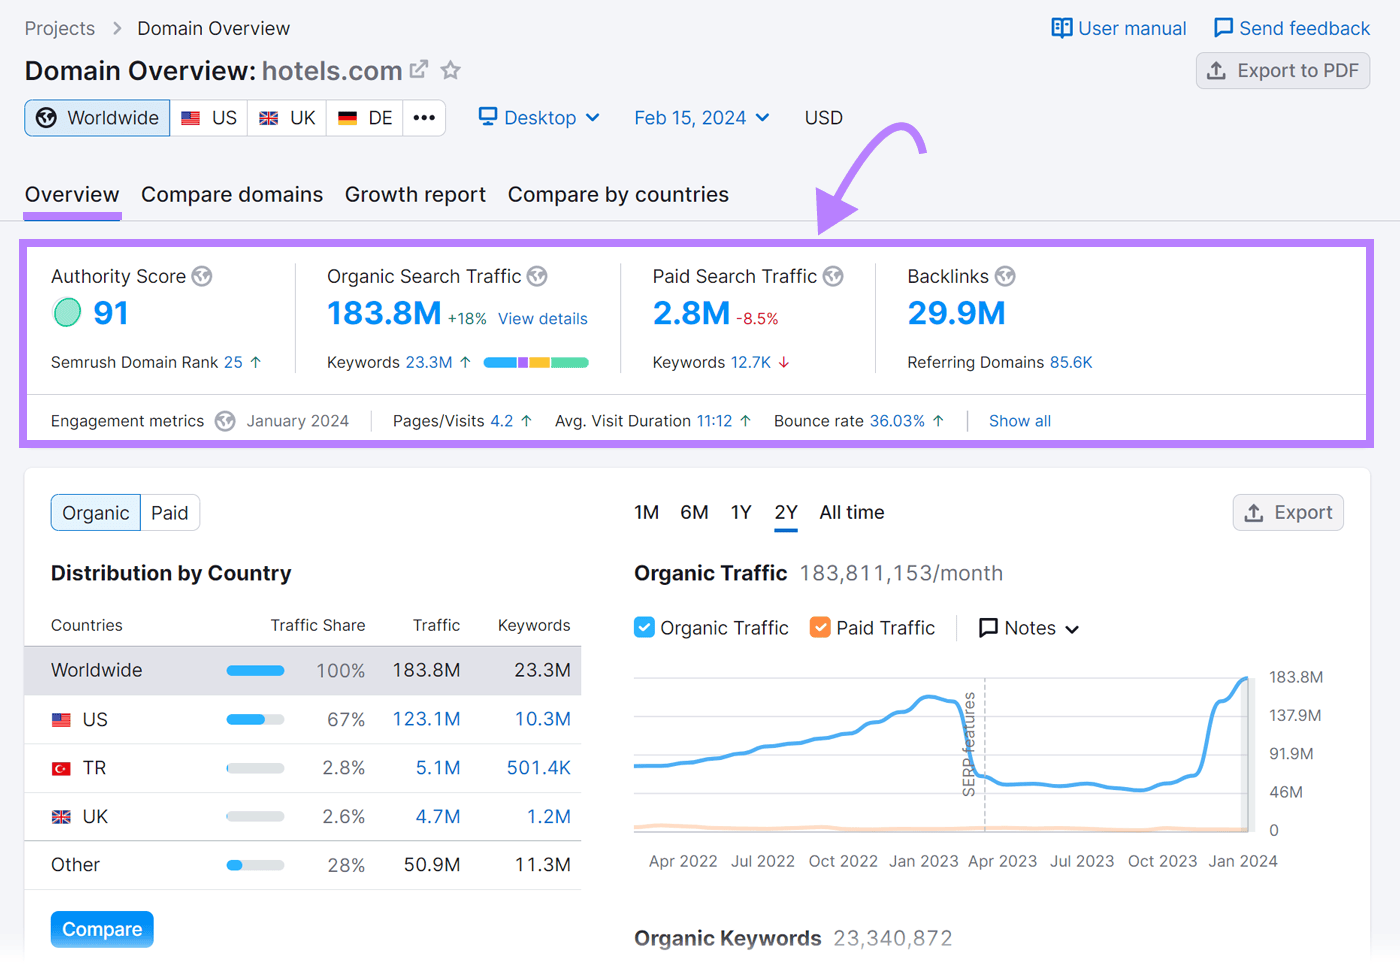
Easily track the above four SEO metrics with a free Google Analytics account. And use Semrush’s Domain Overview to find hidden keyword opportunities. Adding those to your content can attract even more organic traffic.
To start, open Domain Overview.
Enter a domain that you want insights for. Select a location from the drop-down. Then, click “Search.”

The tool will analyze that domain’s competitors and provide a detailed analysis of their traffic sources, backlinks, and ad performance. Use this information to capitalize on your competitors’ weaknesses.
Content Performance Metrics
The following three metrics, along with other content marketing metrics can help you determine how effective your content is.
16. Top Performing Pages
This metric lists the webpages on your site that attract the most traffic.
In Google Analytics, navigate to “Reports” > “Engagement” > “Pages and Screens.” You’ll find a list of all your webpages ranked in descending order in terms of page views.
17. Average Engagement Time
This metric tells you how long, on average, visitors keep your website in focus in a browser or in the foreground of a mobile app.
Calculate the average engagement time metric using the below formula:
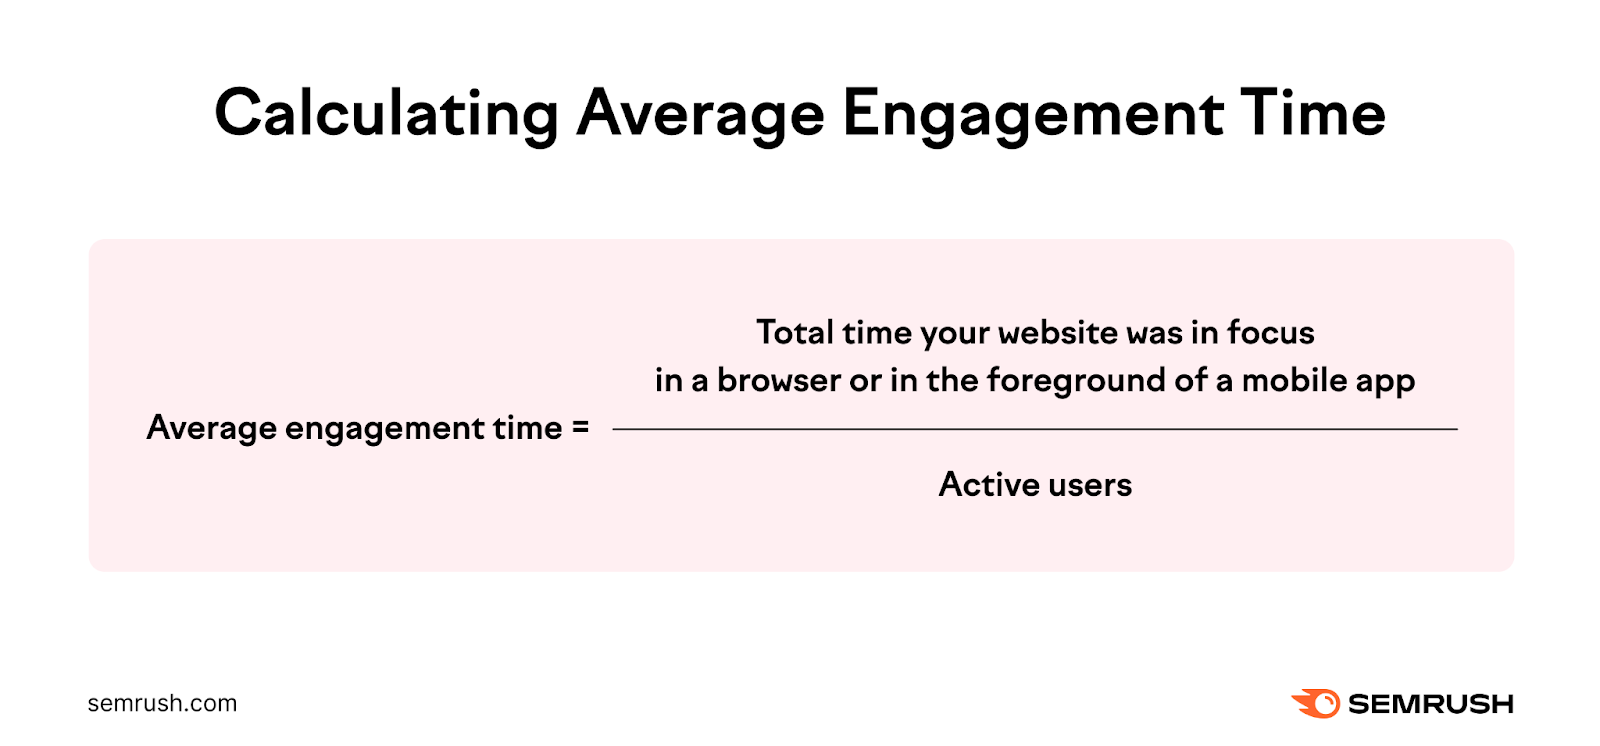
Let’s say that three users, A, B, and C, visited your website in the past hour. User A views your home and the pricing pages for a combined total of five minutes. User B views your home and about us pages for a combined total of three minutes. And user C keeps your website in the foreground on a mobile device for four minutes.
In this scenario, the total engagement time is 5 + 3 + 4 = 12 minutes. Divide this total by the three active viewers. 12 minutes divided by three viewers = four minutes average engagement time.
In Google Analytics, navigate to “Reports” > “Engagement” > “Engagement Overview” to see the average engagement time for your site.
18. Social Shares
This metric tells you how many times your social media posts were shared over a specified period of time.
Let’s say you launched two posts over the past 24 hours. One post was shared 10 times while the other had zero shares. Your total social shares over the past 24 hours is 10 shares.
Because Google Analytics tracks only your website performance, there is no straightforward way to measure social shares on the GA4 platform. Instead, use the Semrush Social Tracker to see a report of how users engage with your social media posts.
Once you log in to your Semrush account, find this tool under the “Social Media” menu.
The tool provides a detailed daily report of total engaged users, reactions, comments, and shares.
Here’s an example:
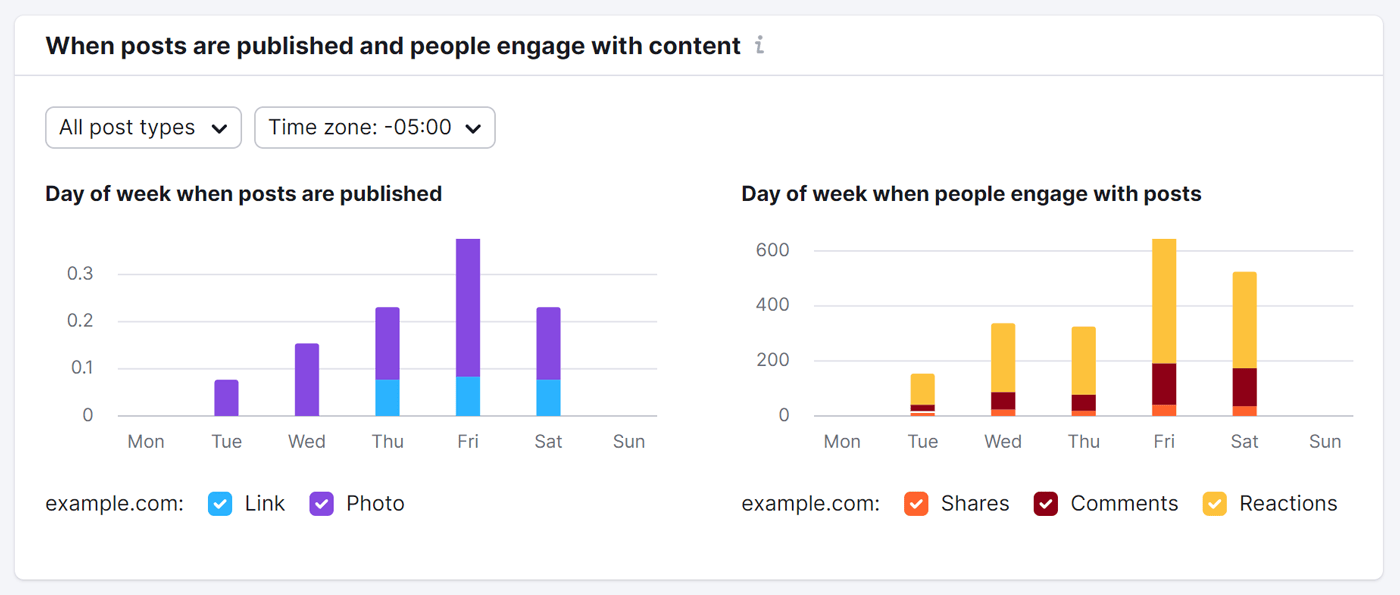
Social Tracker also gives you information on your competitors’ social media efforts. You can switch between profiles using the dropdown menu on the dashboard.
Technical Performance Metrics
Technical performance metrics provide an understanding of your website health.
The following three metrics give a good overview.
19. Page Load Speed
Page load speed measures how many seconds it takes, on average, to display your entire webpage in a browser window.
Page load speeds will vary based on users’ network speed. But it also varies based on internal factors like how many resources the page needs to load. Ideally, you want page load speed under 2 seconds.
Because faster page load speeds improve user experience.
“The probability of bounce increases 32% as page load time goes from 1 second to 3 seconds,” according to Google.
Faster load times can be good for your ranking in search engine results pages, too. Because Google prioritizes pages with good user experiences higher in the results.
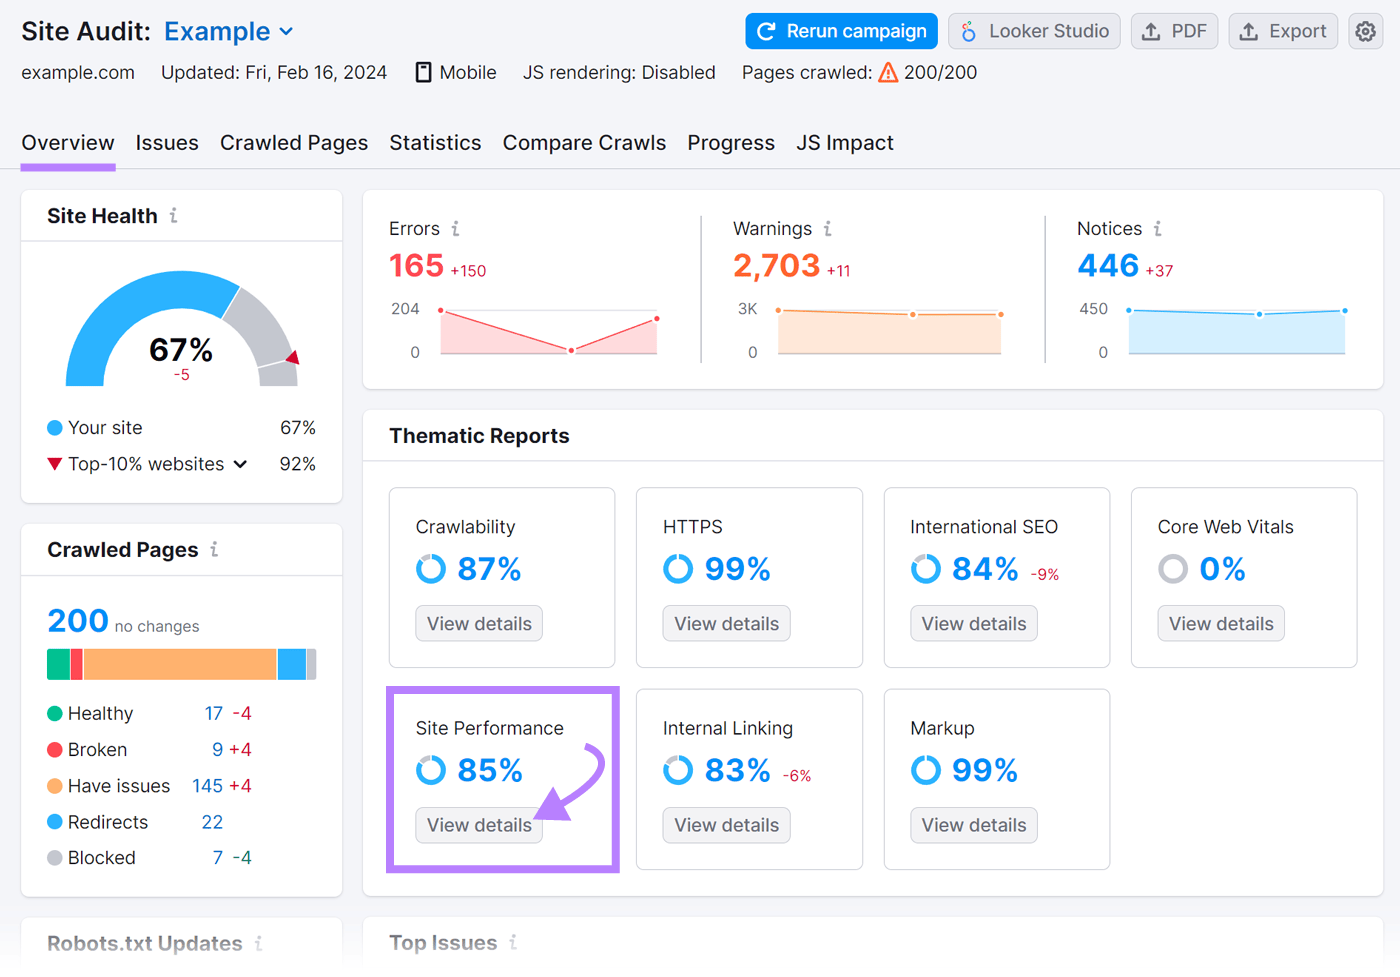
Find your website’s average page (HTML) load speed via Site Audit.
From your project dashboard, locate the “Site Performance” panel under “Thematic Reports.”
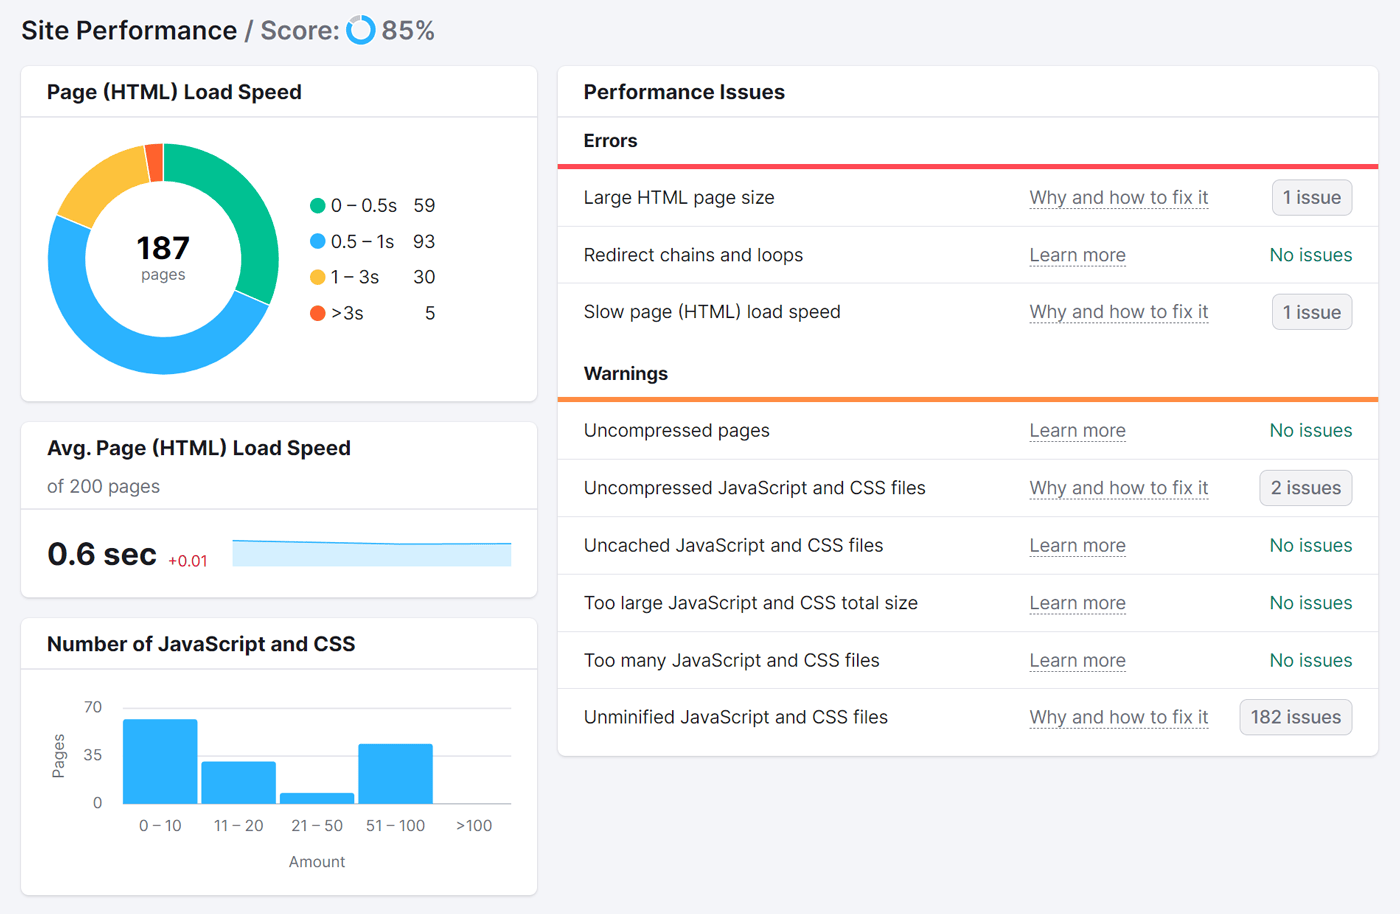
Click the “View details” button.
This report displays data Site Audit got when it crawled your site. It also creates a color-coded, page load speed graph for your webpages.
20. Crawlability
Crawlability refers to how easy it is for search engines to find and index your webpages. This is important because search engines have to index your webpages before they can appear in organic search results.
Internal links, a logical structure, and an XML sitemap improve the crawlability of your site.
Find crawlability information by navigating to “Settings” > “Crawl stats on your free Google Search Console.” Or you could use the Thematic Report in Site Audit to see an overview of the elements affecting your site’s crawlability. And the crawlability issues you can explore and fix.
21. Internal Linking
This metric tells you the number of internal links that point to webpages on your website. Similar to external links, internal links also boost a webpage's authority.
Page authority is a score that reflects how likely a page is to rank in search results. A higher page authority reflects a higher likelihood of ranking at the top of search results. More internal links can lead to a higher authority score.
Site Audit offers a far detailed report of your internal links. This tool’s “Thematic Reports” section includes information on crawl depth, internal link distribution, and internal link errors.
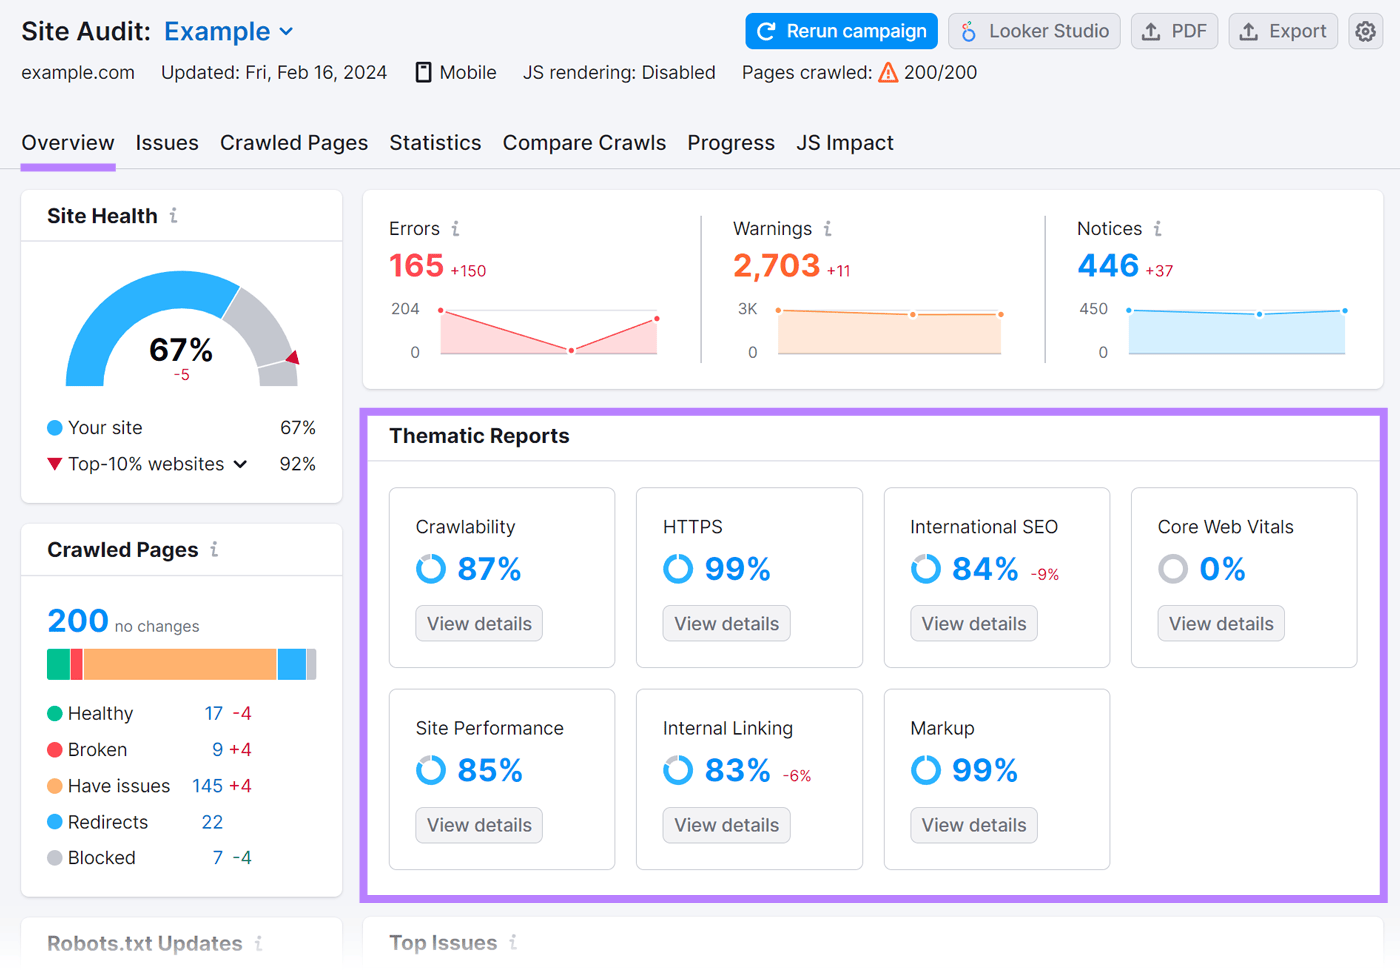
In addition to showing detailed load speed, crawlability, and internal linking reports, Site Audit also scans your website for over 140 technical site health and SEO issues.
The “Overview” report provides an overall site health score based on the number of website errors and warnings. Use this information to address these technical issues.
Customer Satisfaction Metrics
The following three metrics measure your user satisfaction levels.
22. Exit Rate
This metric tells you the percentage of sessions that ended on a particular page. For each webpage, calculate the exit rate as follows:
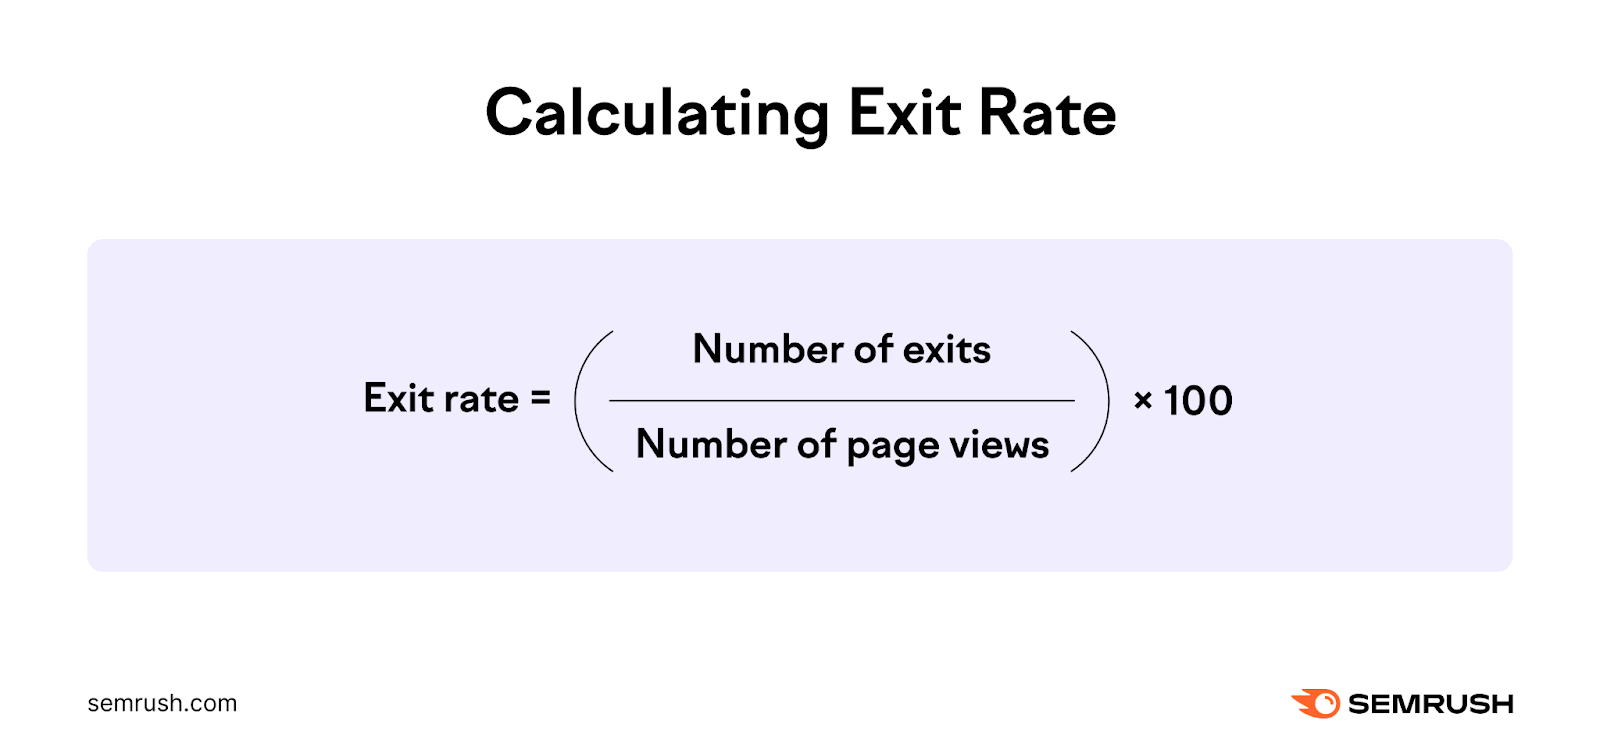
It’s helpful to know which pages most often result in an exit. You can use this information to identify and fix pages that cause most visitors to leave.
23. Customer Satisfaction Score (CSAT)
This metric gives you the percentage of users who self-report feeling satisfied with the interaction they had with your website. Consider using an in-app survey tool like Userpilot or Survicate to collect CSAT from your users.
24. Customer Lifetime Value (CLV)
This business metric measures the average revenue you can expect for each active customer. Calculate CLV using the below formula:
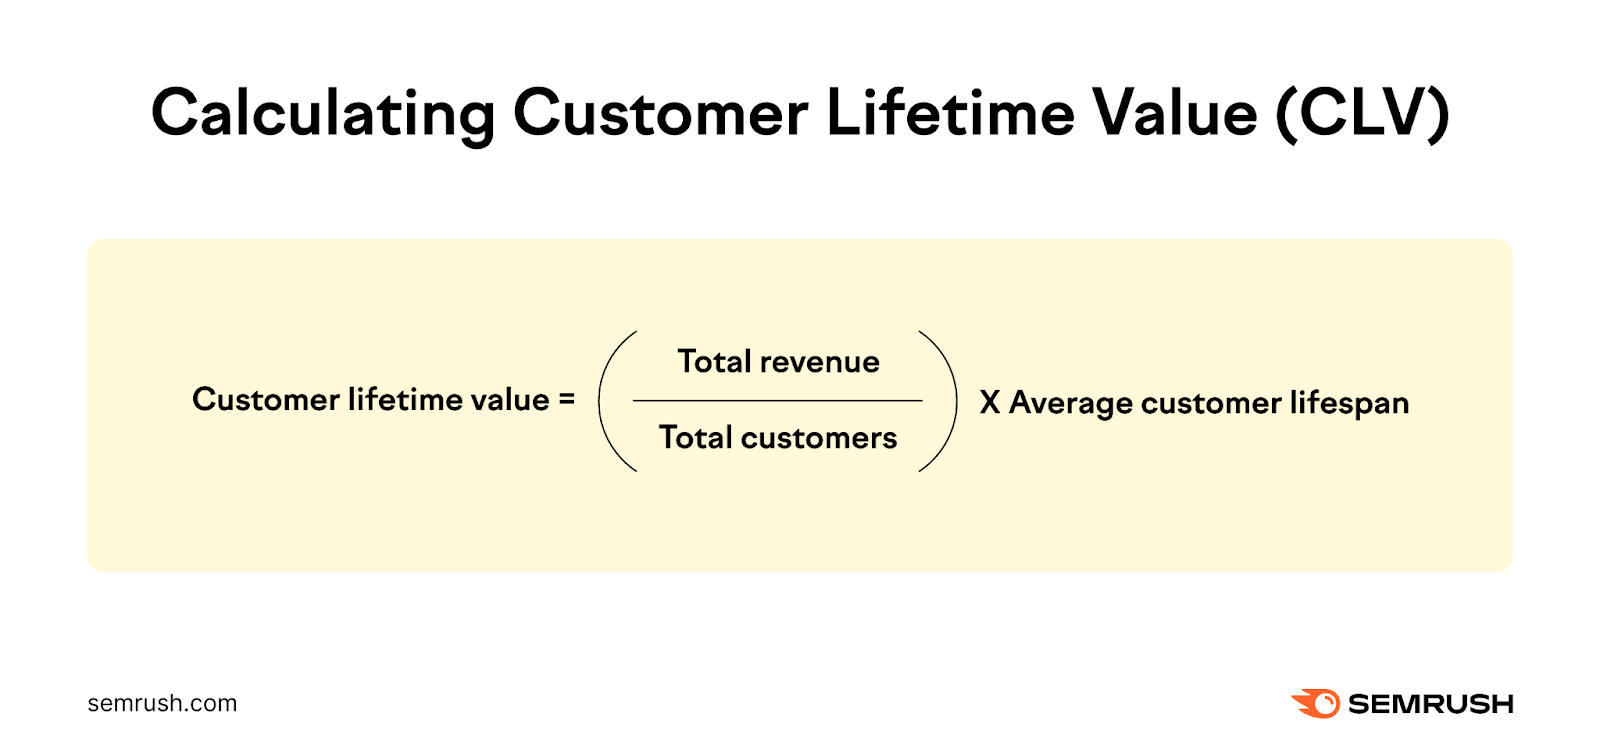
You’ll need information about the total revenue, total number of active customers, and the average customer lifespan from your CRM or accounting software.
Effortlessly Track the Website Metrics That Matter
Tracking these website metrics manually can feel laborious.
But monitoring website metrics is crucial for understanding and optimizing website performance.
Semrush provides a straightforward way to access key website metrics all in one dashboard. Get over 55 different tools, including the ones mentioned in this article, under one Semrush account.