
What Is Report Automation?
Imagine turning hours of data analysis and report generation into a few simple clicks. Giving you more time to focus on strategy and growth instead of menial tasks.
That’s the power of report automation. Which gathers data from various sources and compiles it into comprehensive reports without manual intervention.
You can use report automation in various digital marketing areas, including:
- SEO analysis: Automatically track and create SEO reports on keyword rankings, backlink profiles, and website traffic data
- Social media metrics: Compile engagement statistics, follower growth, and campaign performance across different platforms
- Email campaigns: Summarize open rates, click-through rates (CTR), and subscriber activities
- Paid advertising: Organize data on ad spend, conversion rates, and ROI from various advertising platforms
How Report Automation Can Benefit Your Business
The many advantages of report automation include:
Higher Data Accuracy
Automated tools pull and compile data from various channels without human input. Ensuring your marketing strategy has solid, error-free information.
Meanwhile, manual reporting involves copying and pasting marketing data, which can result in mistakes. Think missed data points or duplicate entries.
Efficient Report Generation
With reporting process automation, you can gather and process data to generate reports faster than you could manually.
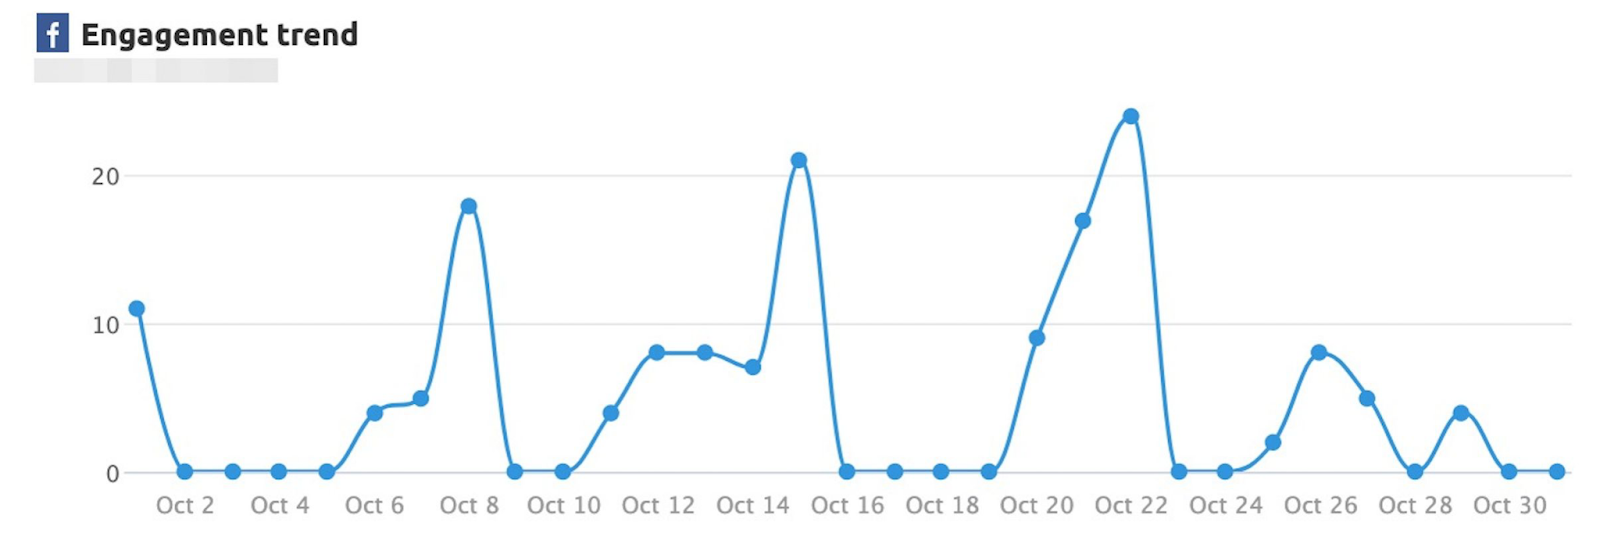
The report below illustrates the level of engagement (likes, comments, shares) that Facebook posts receive on different days of the month.
Consider a scenario in which you must create a weekly Key Performance Indicator (KPI) report to track your business’s performance over time. An automated tool can do this in minutes instead of you spending hours compiling data from multiple sources.
Operational Cost Savings
Report automation can significantly reduce operational costs by minimizing the need for labor.
Automating report generation can save you resources and personnel costs—so you can spend your budget on other crucial business areas.
For example:
If you’re a small agency, reallocate hours spent on manual reporting to more client-focused activities—like communicating directly with clients and conducting detailed market research to identify potential growth areas. This way, you maximize both productivity and profitability without additional staff costs.
Real-Time Data Access
Automated reporting tools continuously collect and update data in real time so you don’t have to wait for periodic manual updates. Meaning you’ll always have the most current data available.
Real-time data access helps you adapt to changing trends as you respond to new information promptly.
Let’s say you’re running a digital ad campaign. Report automation can provide instant feedback on its performance.
You’ll see live metrics like CTR and conversion, allowing you to make quick adjustments—such as shifting budgets to more successful ads. Or tweaking your campaign’s messaging.
Customized Reporting
Through report automation, you can customize reports to highlight metrics that matter the most to your business. And streamline your analysis for more impactful strategies.
Here’s an idea:
Set up an automated report that tracks website engagement metrics like page views, time spent on the site, and bounce rate. This kind of reporting can help you perform a more targeted analysis.
Consider this snapshot from the Reports tab in Google Analytics 4:
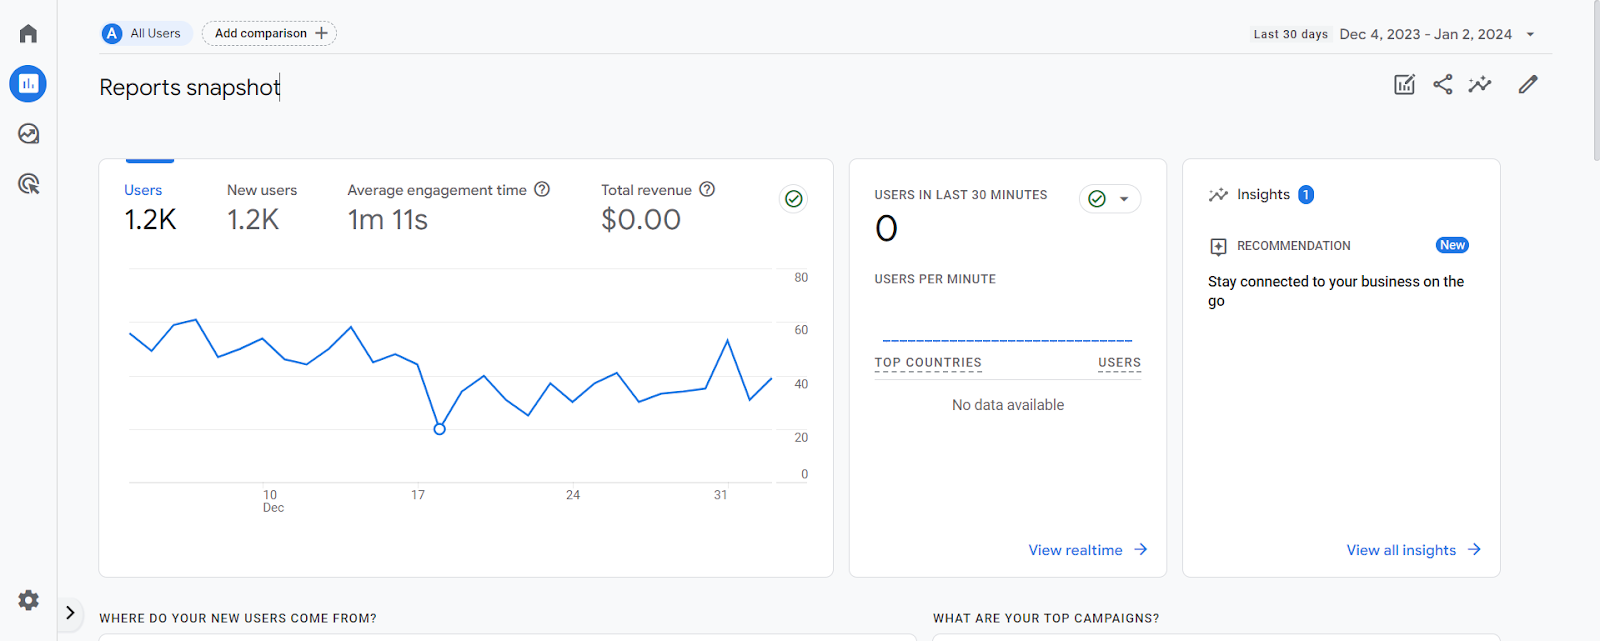
It shows the number of daily website visitors over a 30-day period, how many visitors are new, and their average engagement time.
Easier and Faster Decision-Making
Auto-generated reports present relevant data in a neatly compiled manner. Making it easier for you to spot trends and act on them.
Suppose your holiday campaign report shows a high engagement rate on a specific type of social media post and low engagement on another.
Observing changes as they happen means you can capitalize on the high-performing post (show more like it, use resonating messaging in emails, etc.). And reassess or fine-tune your low performer (like adjusting future social posts).
Low-Effort Competitor Tracking
Automated reporting tools help you track and compare your business against competitors. So you get real-time insights into market trends and performance benchmarks.
Tool features may include dashboards that compare your SEO performance against your top competitors. So you know where you stand and can identify areas for improvement.
What Are Report Automation Types?
There are several types of report automation, each suited to different levels of technical expertise and business requirements.
Some common types include the following:
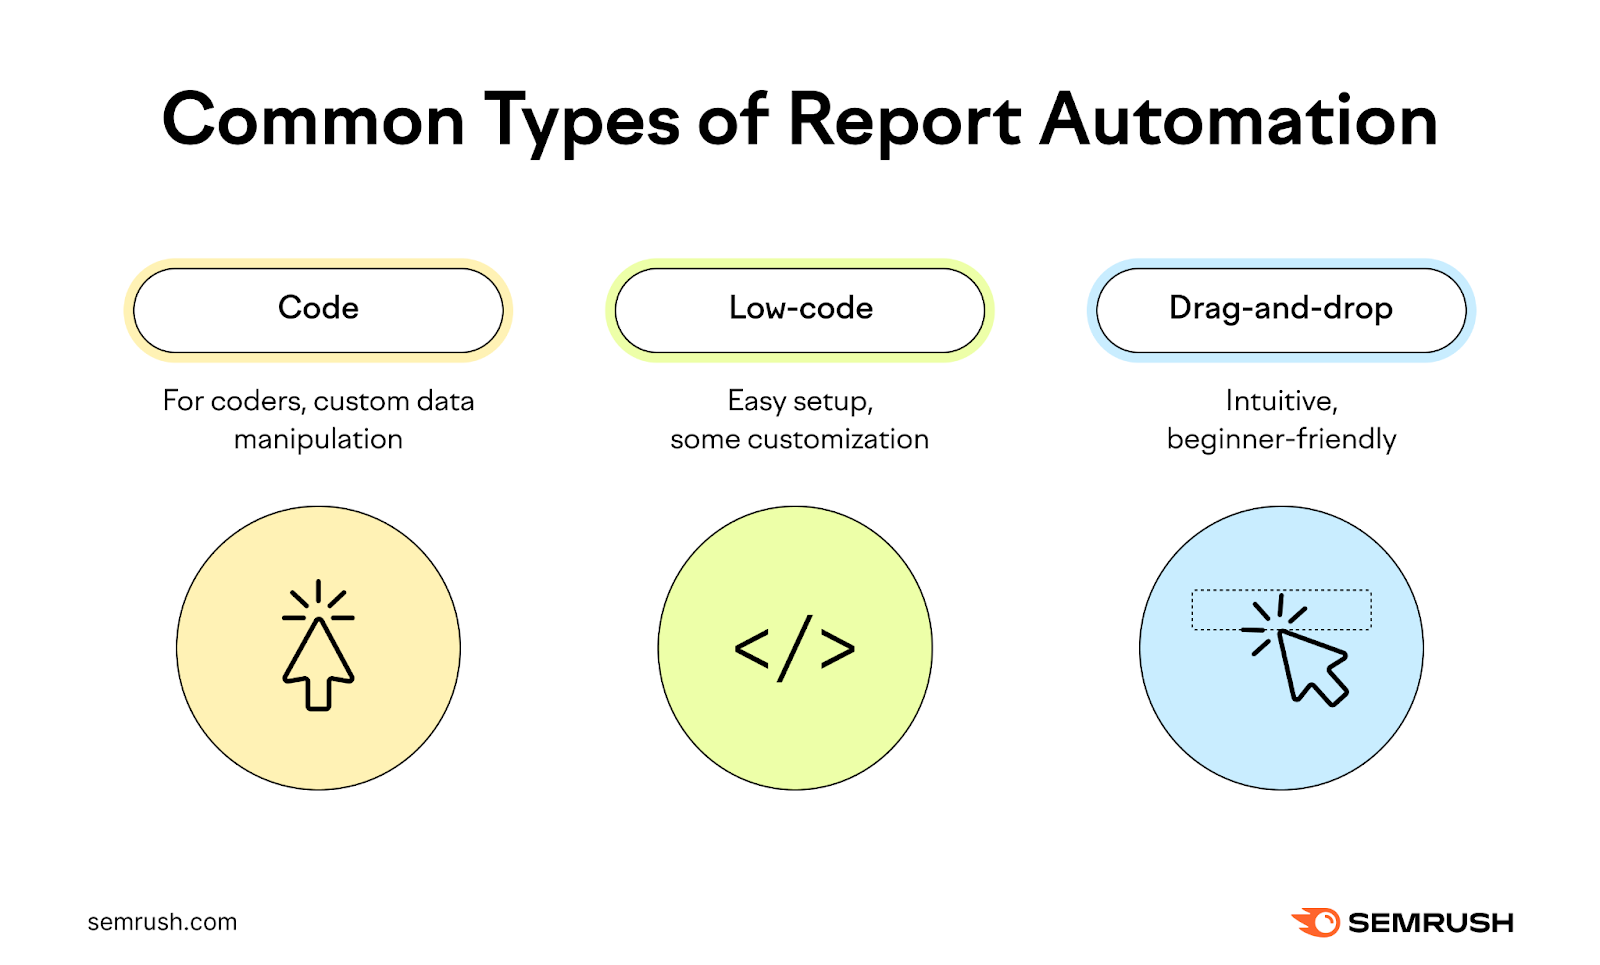
- Code reports: Ideal for individuals with programming skills. They use specific coding languages for high customization so you can extract and manipulate data. Look for tools that support coding languages you’re familiar with and offer advanced customization options.
- Low-code reports: Require minimal coding knowledge as they offer straightforward setup and modification options. Use tools that offer a balance between customization and ease of use.
- Drag-and-drop reports: Their user-friendly interfaces are perfect for beginners. Choose tools that allow you to generate reports through intuitive interfaces with drag-and-drop features.
Understanding these report automation types helps you identify which tools align with your technical expertise and business reporting needs.
Further reading: 6 Types of Reports for Making Data-Driven Decisions
What to Consider When Setting Up Report Automation
Goals
Having clear goals helps you identify the areas you need to focus on with report automation.
Ask yourself: What specific outcomes do I want to achieve with this solution?
Your desired outcome might be to get precise insights to make better decisions, improve operational efficiency, or track specific project progress.
For instance, if a report’s data shows that a product is selling well, you can decide to increase production or invest more in marketing.
If a particular strategy boosts customer engagement, you might want to invest more in refining it. Your goal in this case is to make better strategic and product-focused decisions based on the report data.
By defining goals, you’ll be able to tailor your automated reporting system to your specific needs.
KPIs
Once you know your goals, set up relevant KPIs and metrics that reflect your project’s objectives.
Let’s say you’re building a single report for an ecommerce site.
Start by identifying your primary objectives. Do you want to increase sales, improve customer retention, or reduce costs? Choose KPIs that directly reflect these objectives.
For instance:
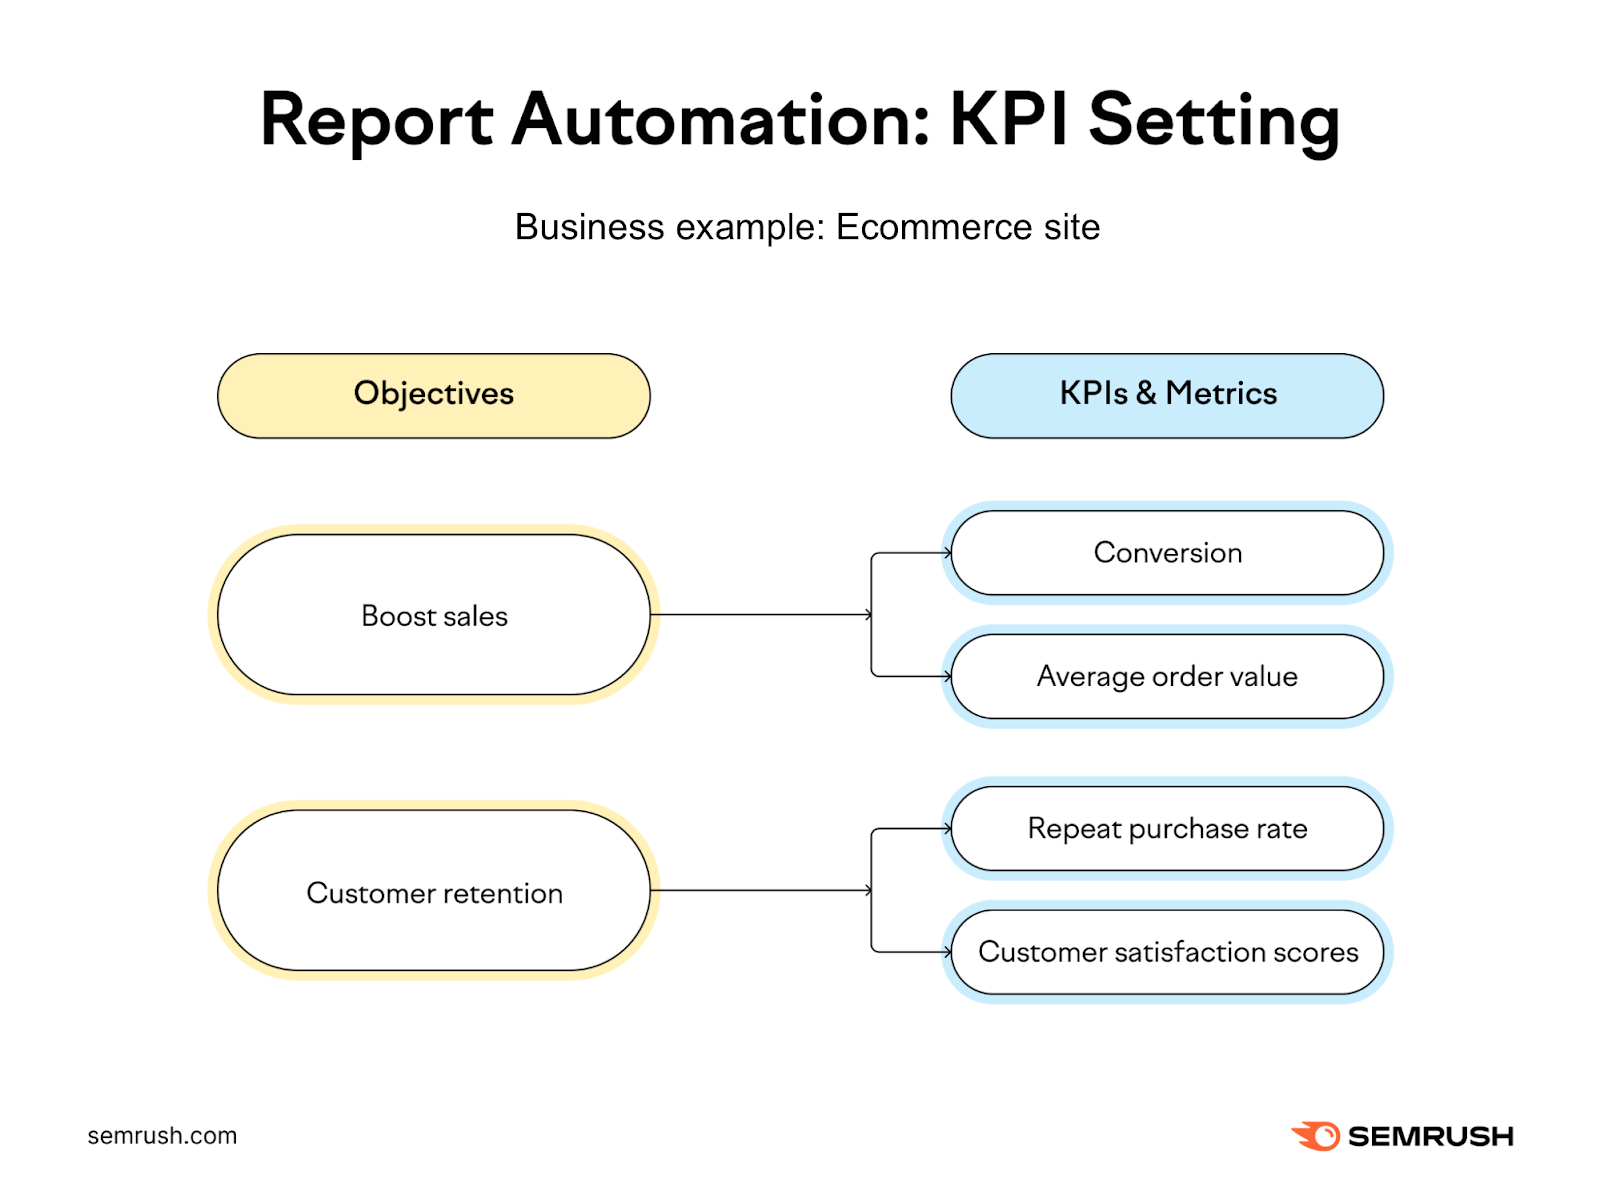
If your target is to boost sales with your campaigns, focus on KPIs like conversion rate and average order value. If it’s customer retention, monitor metrics like repeat purchase rate and customer satisfaction scores.
Report Format
A consistent, clear, and actionable format will ensure that your reports are easy to understand and act on.
Decide whether your reports should include visual elements (e.g. charts and graphs) or contain text-based summaries.
It’s like choosing the best way to tell a story. Some stories are best told with pictures, others need detailed narratives.
Charts and graphs make trends and patterns easier to see and understand at a glance. Great for showing progress over time, comparing different data sets, or highlighting key metrics (like sales and marketing trends).
Here’s an Advertising Research report showing changes in paid search traffic:
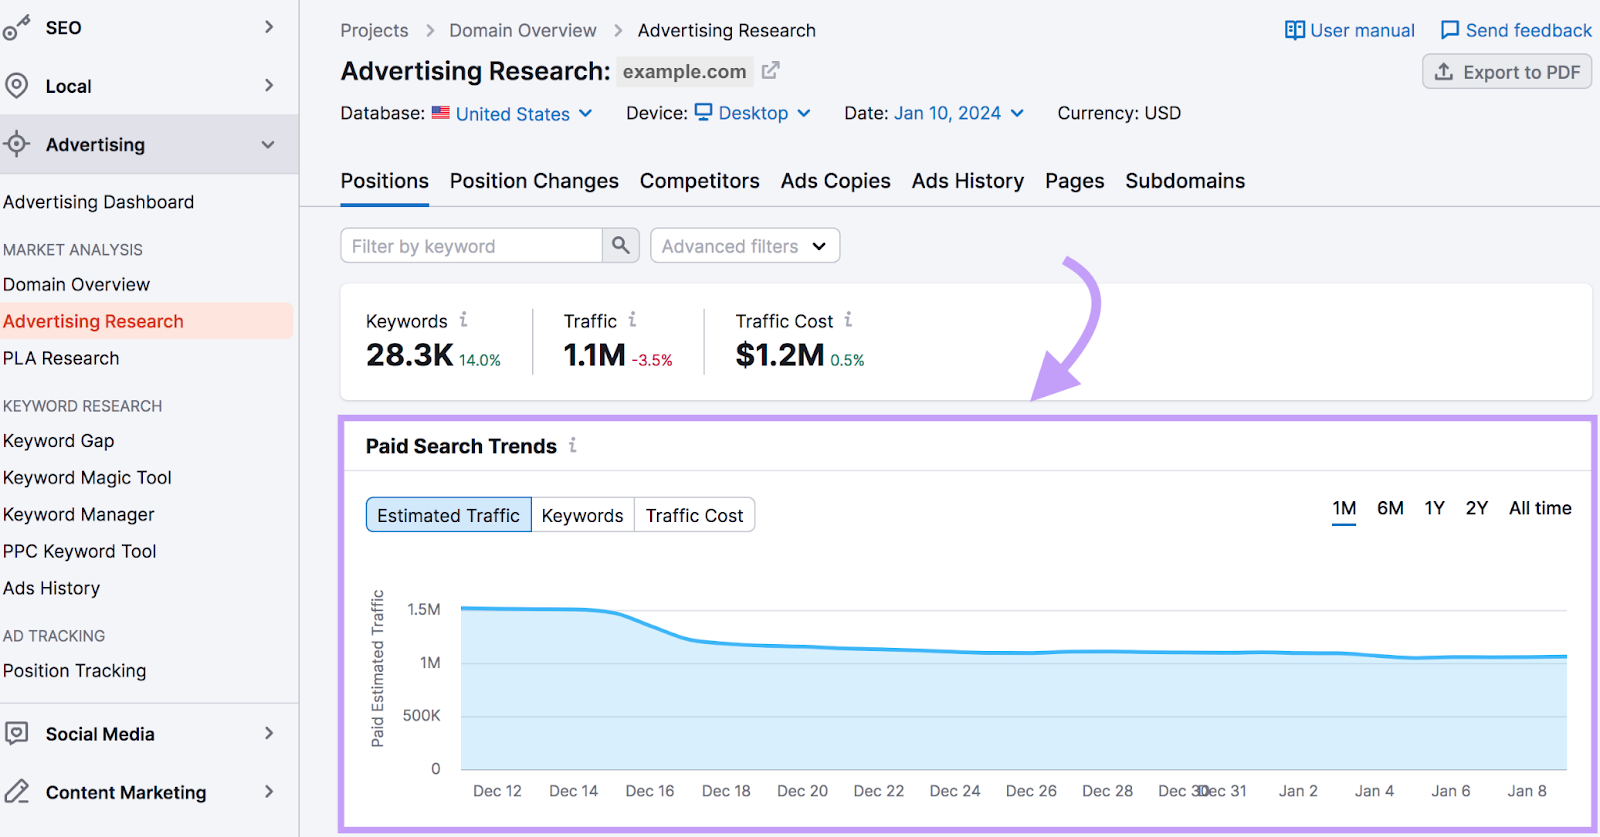
Visuals can make an impactful impression when you want to communicate data quickly, clearly, and effectively.
Text-based reports are ideal for providing added context. Think in-depth analyses, descriptions of processes, and detailed documentation (financial figures, legal guidelines, etc.)
Reporting Frequency
Decide on a reporting frequency that matches the pace of your business needs.
Data from business operations, including sales and website traffic, often require daily reporting. For strategic data like monthly marketing performance or quarterly sales trends, you may require less frequent reporting for more thorough analysis.
Also, assess whether a real-time, continuously updating report is necessary. If not, you can run static reports at specific intervals—like monthly financial briefs.
Automated Reporting Tool Features
There are several automated reporting tools, and selecting the right one will help you optimize data reporting as it adapts to your business.
Below are some key features to look for in an automated reporting tool. Followed by our top four tool picks.
- Scalability: Choose a tool that can grow with your business. It should accommodate increasing data volumes and user access as your operation expands.
- Data security: Opt for powerful tools with robust security features. Look for encryption, role-based access control, and regular data auditing to ensure your data’s safety.
- Performance efficiency: Ensure the tool offers fast, reliable performance—through quick data processing plus accessibility from various locations and devices
- Integration with multiple data sources: The tool should seamlessly integrate with different data sources you use, such as CRMs, reporting platforms, and financial systems
- Customization options: Look for tools that offer a high degree of customization. So you can tailor reports to your specific business requirements and adjust as they evolve.
- User-friendly interface: Prioritize reporting software with an intuitive interface. All team members should be able to easily navigate the tool, regardless of their technical expertise.
4 Examples of Report Automation Tools
Here are our top four recommendations for report automation tools and their main functionalities.
Looker Studio
Google’s Looker Studio (formerly Google Data Studio, or GDS) stands out for its ability to transform complex data into understandable, visually impactful reports.
Like this one:
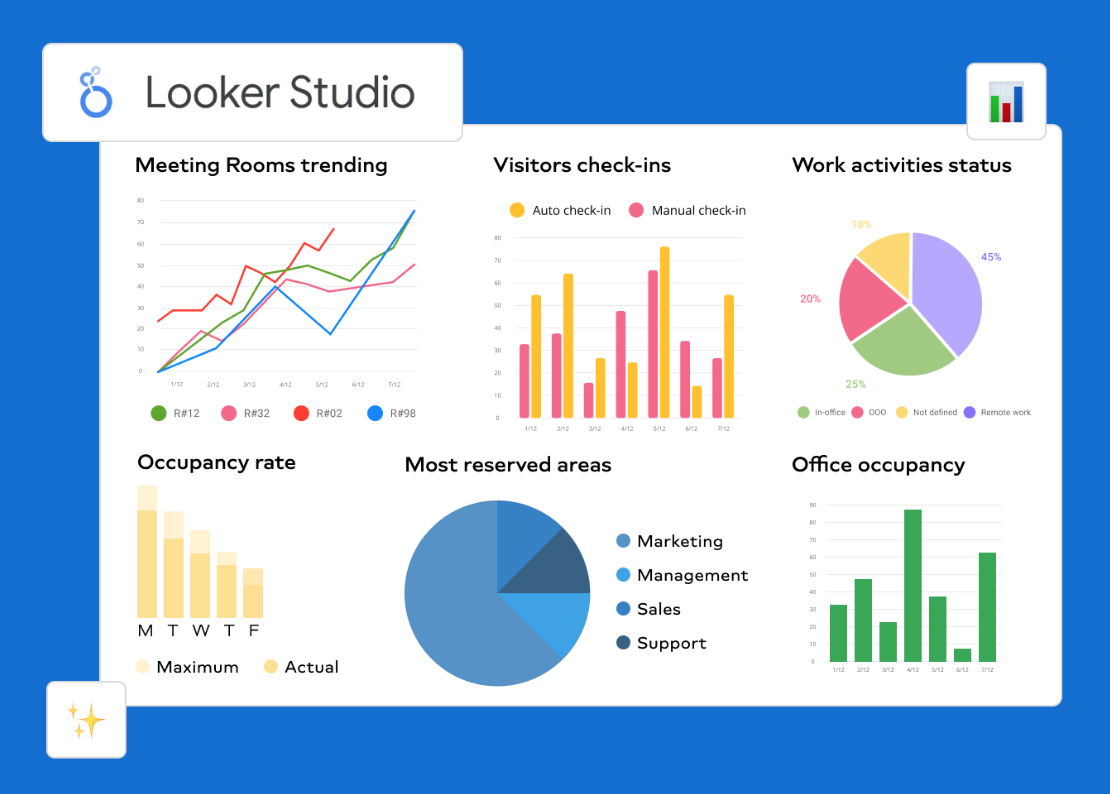
Looker Studio is ideal if you want to create custom reports and complex dashboards. Features like data blending, custom segments, and dimension breakdown can be challenging. But they offer powerful reporting capabilities.
Further reading: Learn how to set up Looker Studio and run reports with our detailed tutorial.
To use this tool effectively, you need to add specific data sources (connectors) that Looker Studio will access to build your reports.
For instance, you can add three Looker Studio connectors that extract data from your Semrush account:
- Domain Analytics: For comprehensive insights into your domain’s SEO and paid search performance
- Site Audit: For a quick and clear understanding of your site’s essential areas for improvement. Like performance, linking, and crawlability.
- Position Tracking: For data on organic and Google Ads positions for target keywords. Plus an in-depth overview of rankings across the top 100 search results.
Semrush Reporting Automation
Semrush offers report automation through two main methods.
You can set up automatic email delivery of reports at scheduled intervals. You can schedule and send automated reports from Semrush tools to multiple email addresses.
And if you have clients of your own, Semrush offers a client portal for convenient data sharing.
This flexibility caters to different needs. Whether you want to send team members regular updates or provide clients with a centralized location to access their reports.
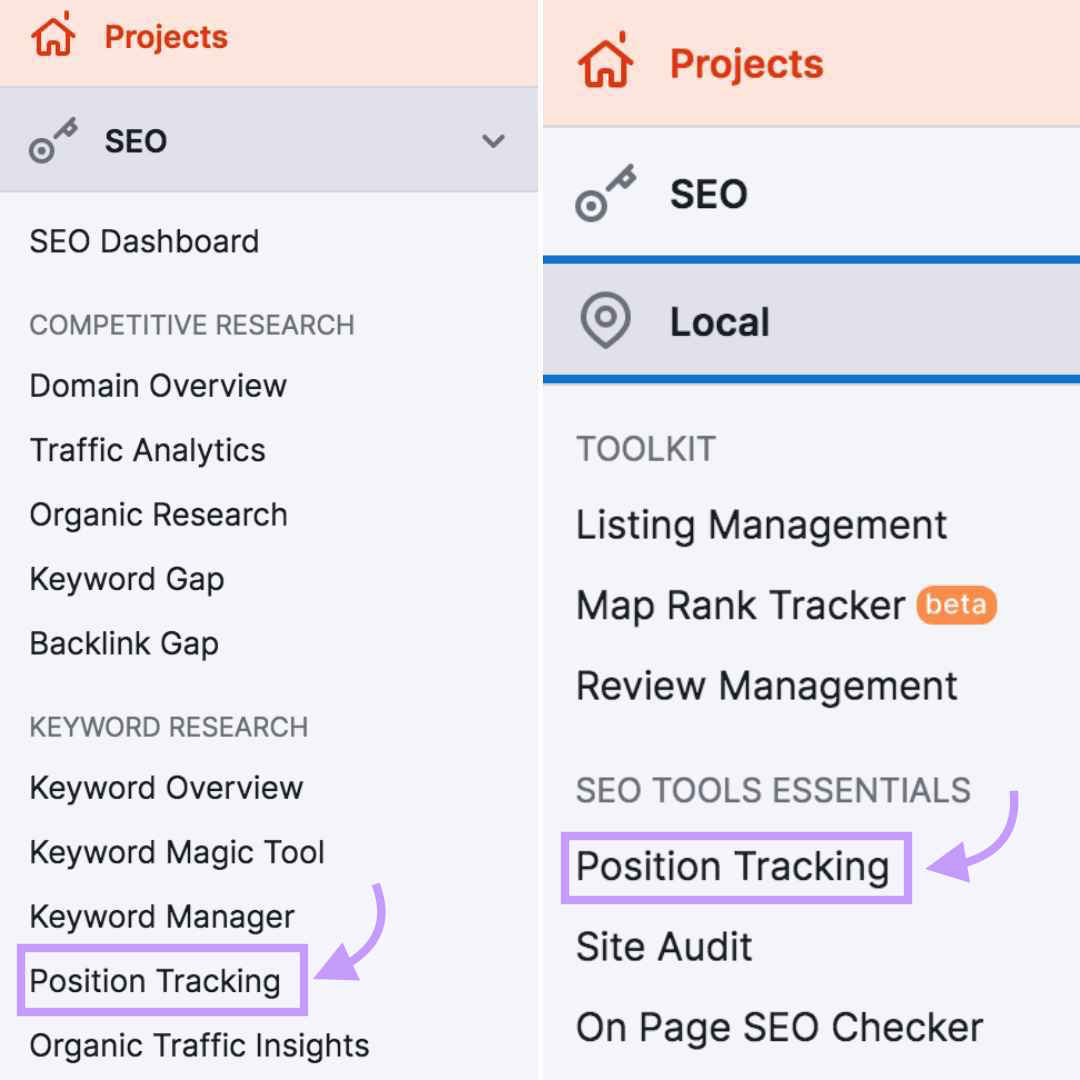
Let’s consider the Position Tracking tool, which lets you track any keyword and domain across multiple regions and device types.
Click on “Position Tracking” from the left-hand sidebar—under both the “SEO” and “Local” dropdowns.
Next, select your project.
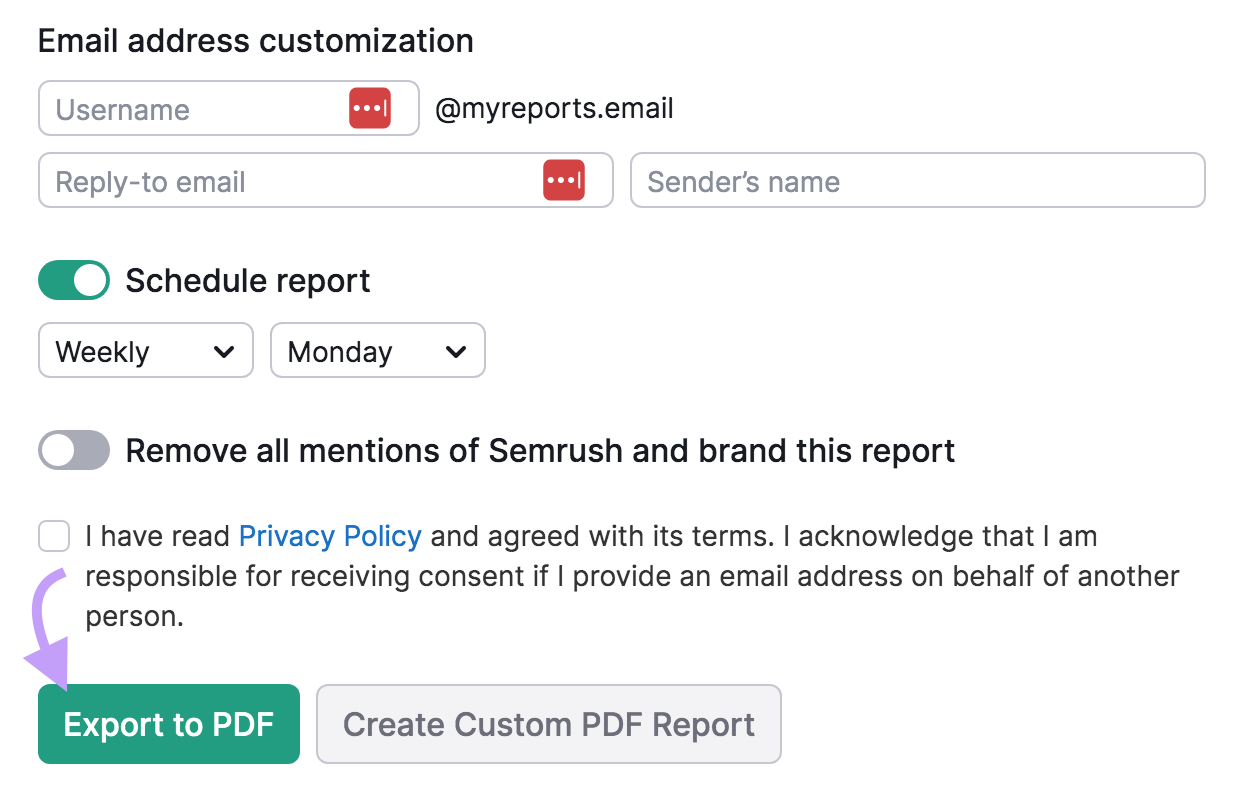
Click on the “PDF” button on the top right of the reports page.
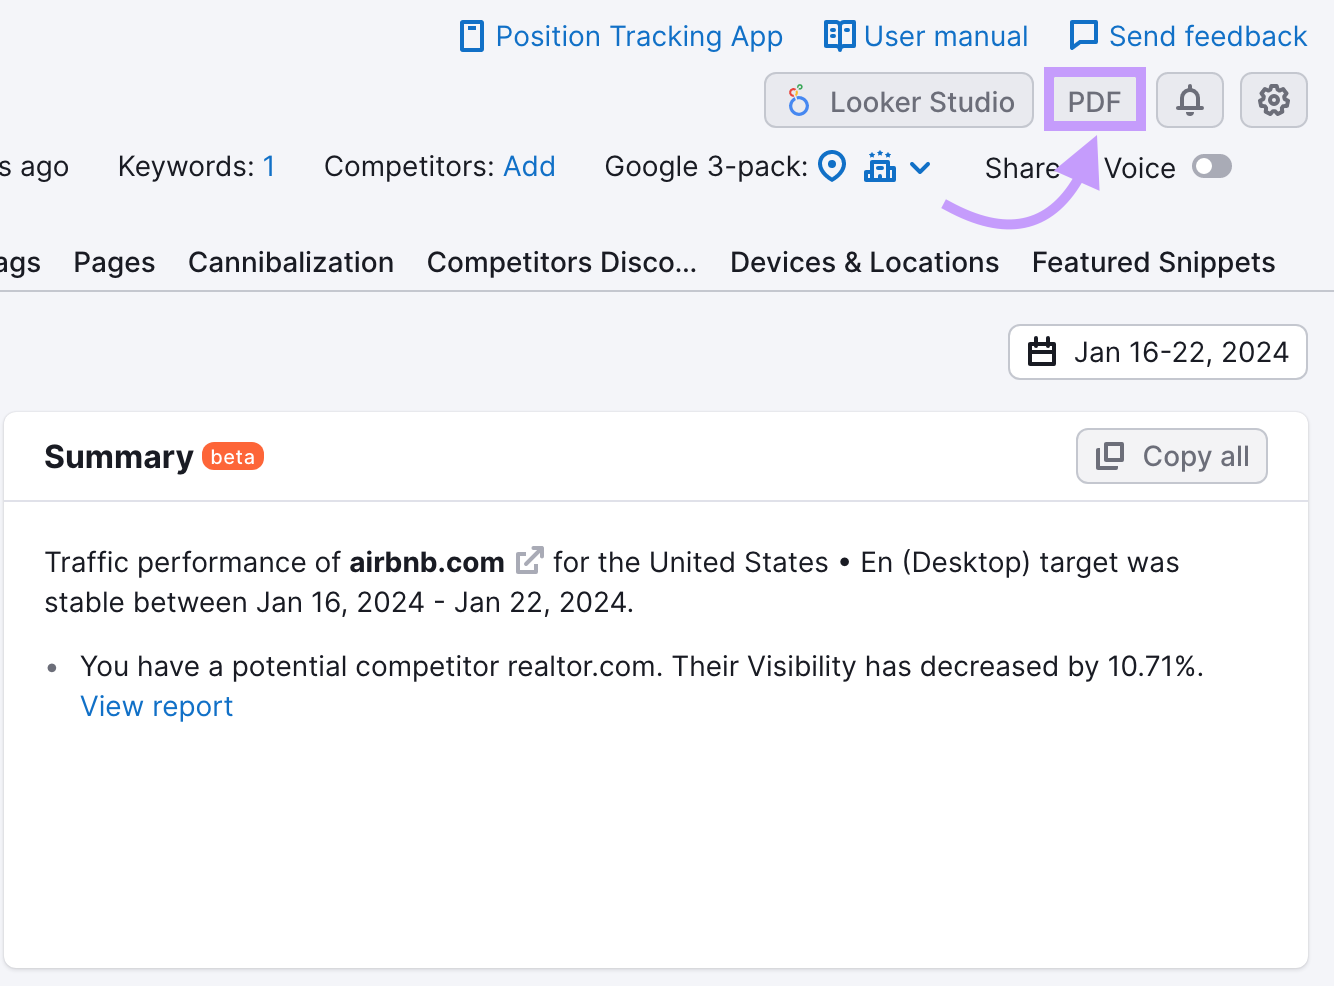
Check that the toggle switch beside “Schedule report” is on, and set the schedule according to your preferences.
Click on the “Weekly” dropdown menu to choose between sending daily, weekly, or monthly reports. You can also select the day of the week with the “Monday” dropdown menu.

Include other elements like email addresses, subject, and body text, then click the “Export to PDF” button to complete the process.
Other Semrush tools that offer report automation include:
- EyeOn for weekly updates on competitor activity. Including new webpages, social media posts, and Google ads campaigns.
- My Reports to create custom marketing and SEO reports from scratch using drag-and-drop functionality with available templates
- Agency Growth Kit for customizing and branding your auto-generated reports. Plus individual password-protected account setups in Client Portal for easily accessible client reports.
Power BI
Microsoft Power BI is a business analytics tool that provides interactive reports and business intelligence capabilities. Its interface is simple enough for users to create data visualizations and custom dashboards.
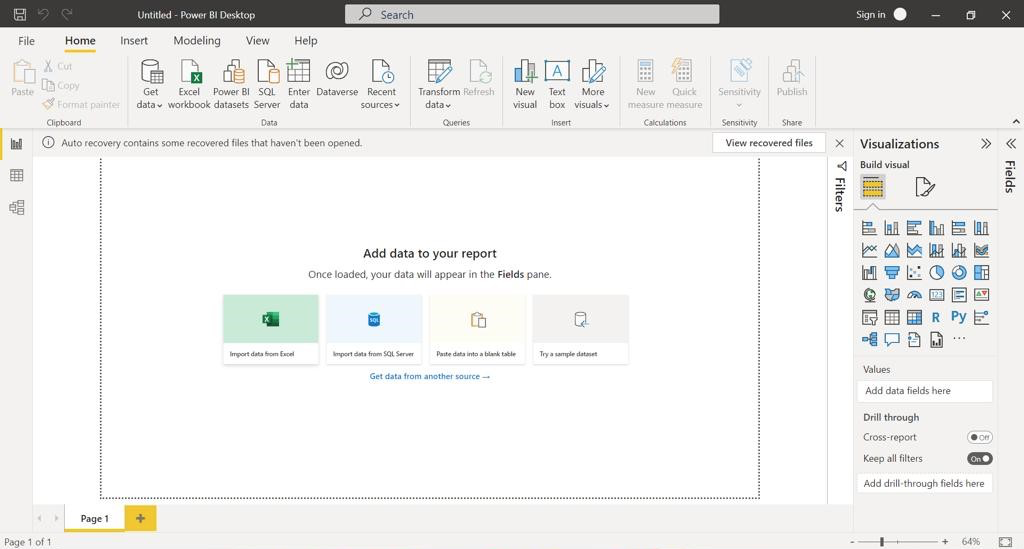
Some of its functionalities for report automation include:
- Subscription to report sheets: Allows users to subscribe to specific report sheets and get email updates
- Customizable frequency of updates: Set the frequency of email updates to align with your data refresh schedules
- Scheduled interactions: The flexibility to schedule interactions at specific times. Allowing for up to 24 different subscribers per report plus regular updates at different intervals.
Tableau
Tableau is a data visualization tool for creating interactive dashboards, charts, and graphs.
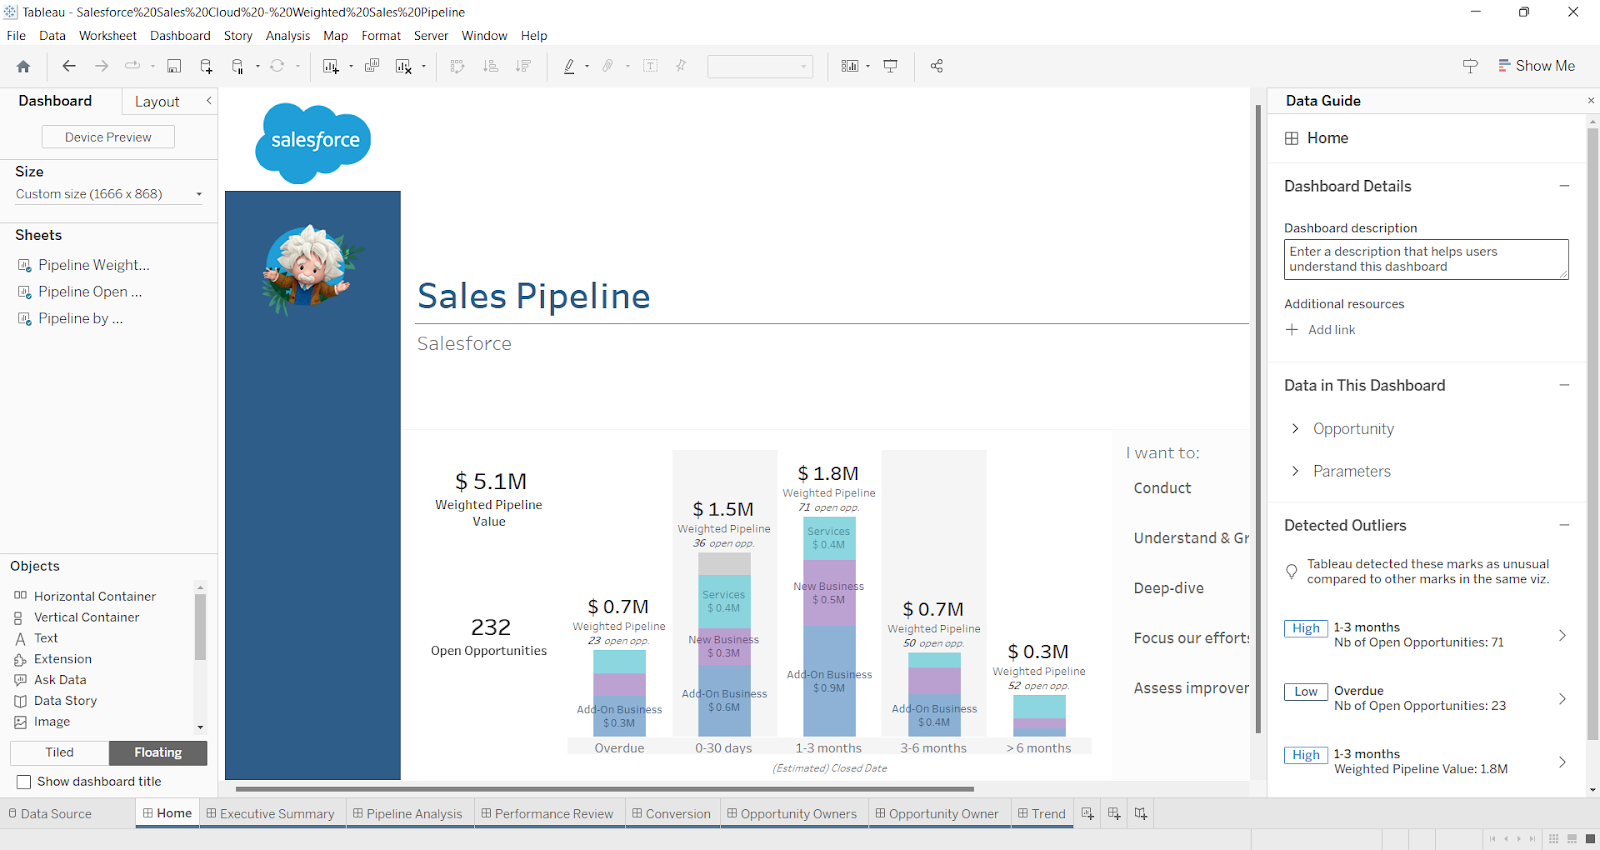
Its primary features for report automation are:
- Tableau Server: Facilitates automated reporting by allowing you to schedule automated reports and control content access
- Third-party integration: Users can integrate Tableau with third-party automated reporting tools for advanced scheduling and data processing capabilities
- Subscription features: Set up subscriptions for yourself or your team members, choosing a suitable frequency of report delivery
Monitor Your Digital Marketing Efforts with Report Automation
Semrush’s reporting automation can transform your data analysis process, helping you make prompt business evaluations and decisions as you go.
To experience the power of report automation and start your journey toward smarter, more efficient digital marketing, sign up for a Semrush free trial today.