
Staying informed of the latest advertising industry trends is key to achieving your goals as a digital marketer.
It eliminates guesswork, helping you adapt your marketing strategy. So you can align with shifting consumer and competitor behaviors, emerging platforms, and changing preferences.
With that in mind, we’ve created a compendium of the most important advertising statistics. Keep it handy to guide your digital ad spending in 2024 and beyond.
Let’s dive in.
Mobile Advertising Statistics
Most internet users have smartphones. That makes mobile marketing essential if you want to reach and engage customers online.
Here’s what the data says about the current state of mobile advertising:
- 95% of internet users browse on a mobile device at least some of the time (DataReportal, 2023)
- Mobile devices account for approximately 57% of people’s online time (DataReportal, 2023)
- Mobile devices account for 53% of the world’s web traffic (DataReportal, 2023)
- There are 5.56 billion unique mobile phone subscribers worldwide—that’s 69.1% of the population (DataReportal, 2023)
- $205.4 billion of total social media ad spending will be generated through mobile by 2027—up from $170.3 billion in 2023 (Statista)
- Advertising drives $2 of every $3 spent on mobile (Data.ai, 2023)
- Paid mobile YouTube ads are 84% more likely to capture viewer attention than traditional TV commercials (Google)
- Over 70% of YouTube views are on mobile devices (Khoros, 2022)
- 96% of users access Facebook via mobile devices (Khoros, 2022)
- Mobile ad revenues reached a record $154.1 billion in 2022, up 14.1% year-over-year (YoY); mobile now has a 73.5% market share of total internet ad revenues (IAB, 2023)
- TV ads (30.6%), social media ads (27.7%), website ads (22.3%), mobile ads (20.6%), and video ads (16.9%) all feature in the top 15 sources of brand discovery (DataReportal, 2023)
We’ve long known mobile marketing is important. These stats confirm that consumers’ love for smaller screens continues to grow.
Spending increases tell us advertisers see this trend too. They’re responding by allocating even more of their budgets to mobile search, social, and video marketing. To keep pace with the competition, you’ll need to do the same, and use the right ad formats.

Further reading: Explore the mobile ad formats and tactics available to you, and learn how to choose the right ones in our guide How to Leverage Mobile Advertising.
Social Media Advertising Statistics
The social media marketing landscape changes frequently. It aligns with consumers’ evolving preferences around content consumption.
Stay on top with help from these social media advertising statistics:
- More people discover new brands, products, and services via social media ads than by word-of-mouth recommendations, brand and product websites, and consumer review sites (DataReportal, 2023)
- Social media ads are the top source of new brand discovery for internet users aged 16-24 (DataReportal, 2023)
- The top three social media channels based on potential ad reach in the United States are:
- Facebook: 188,050,000
- Instagram: 161,700,000
- TikTok: 150,000,000+
(DataReportal, July 2023) (TikTok, March 2023)
- The average click-through rate (CTR) for a social media ad is 1.36% (Statista, Q2 2023)
- Social media ad spending is projected to reach $207.1 billion in 2023 (Statista, 2023)
- The average U.S. social media buyer is projected to spend $779 via social networks in 2024, and $937 in 2025 (Insider Intelligence, 2022)
- There are 4.88 billion social media user identities—equating to 60.6% of the population (DataReportal, 2023)
- Social media users are currently growing at a rate of 9.6 new users every second. (DataReportal, 2023)
- The average social media user spends 2 hours and 24 minutes using social media every day (DataReportal, 2023)
- The average social media user uses 6.7 platforms per month (GWI/DataReportal, 2023)
Brands have traditionally used social media as a promotional tool to build awareness and engage with target audiences. That remains crucial.
But now, consumers can buy products directly on social platforms. The advent of social commerce introduces a new dimension to marketing strategies.

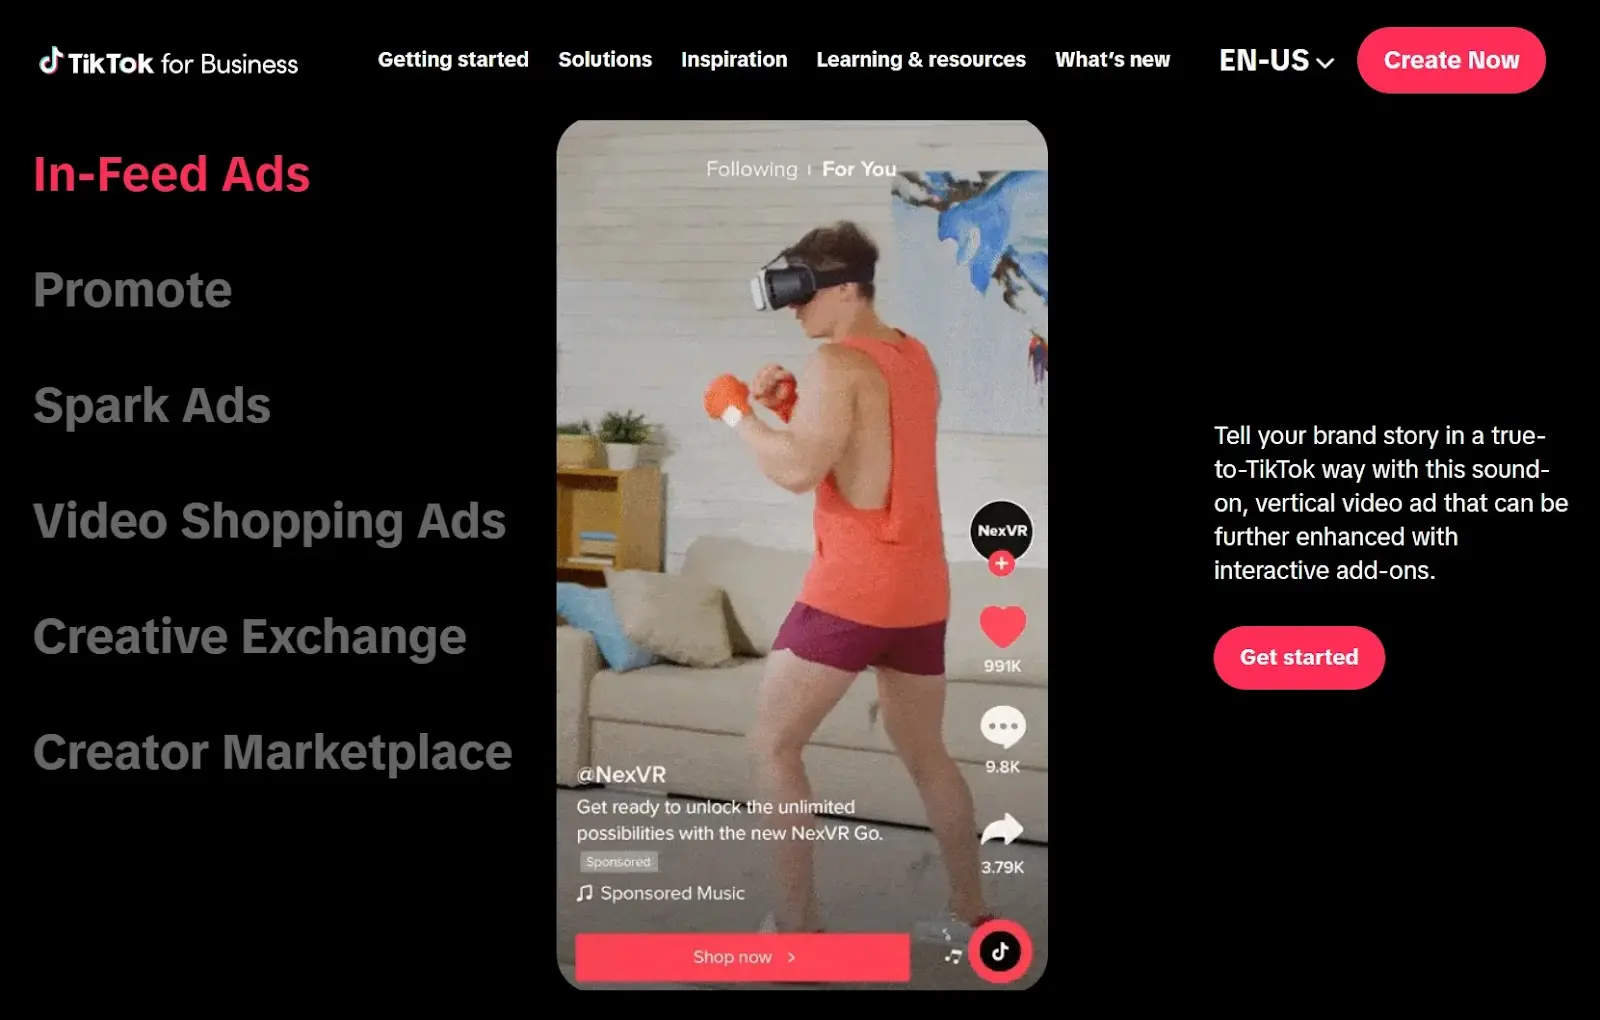
With consumers now able to buy through direct links (like in the TikTok example above), it’s vital to vary your online ads. Use some to drive traffic to your online store, and others with more direct language to encourage quick sales.
Further reading: We run through the best social networks for advertising and offer tips on building persuasive ad campaigns in our Beginner’s Guide to Social Media Advertising.
Facebook Advertising Statistics
As the most-used social media platform in the world, Facebook can be an ideal place to target almost any demographic with online ads and other marketing campaigns.

Here are some telling stats on Facebook’s current position in the advertising market.
- Facebook has the largest reach of all social media advertising platforms in the U.S., with 188,050,000 users (DataReportal, 2023)
- Only 25% of users access Facebook via laptop or desktop (Khoros, 2022)
- 40% of Facebook advertisers use the Click-to-Messaging format (Meta, 2022)
Despite many of its competitors achieving mass popularity in recent years, Facebook remains hugely relevant to internet users. That means it’s almost certainly relevant to you as an online advertiser, too.
In particular, pay close attention to Facebook’s “Click-to-Message” feature, which looks like this:

Image Source: ShopPop
Giving users a direct and personal channel to your business can help you build stronger relationships and influence purchasing decisions. While learning about your target audience.
With fewer than half of Facebook advertisers using the feature currently, there’s an opportunity to get ahead of your competitors.
Further reading: The more efficient your ad strategy is, the better your return on investment will be. Learn how to save without compromising results in our guide on How to Keep Facebook Ads Costs Down.
Instagram Advertising Statistics
Instagram’s advertising versatility makes it a marketer’s dream.
From sponsored content and boosted posts to Stories, Reels, and shopping links, there are plenty of ways to reach and engage your ideal customers.

Here are the Instagram advertising statistics you need to know:
- Instagram has the second largest reach of all social media advertising platforms in the U.S., with 161,700,000 users (DataReportal, 2023)
- An estimated 71% of U.S. businesses have Instagram accounts (Khoros, 2022)
- Over 200 million businesses use Instagram’s advertising platform (Instagram, 2023)
- On average, Instagram users spend 30.1 minutes per day on the platform (Khoros, 2022)
- 83% of users say they discover new products and services on Instagram (Khoros, 2022)
- 61% of Instagram’s advertising audience is age 18 to 34 (Stastista, 2023)
- Less than 7% of Instagram’s advertising audience is over 55 (Stastista, 2023)
Competition will always be strong on Instagram. But the fact that users spend so much time on the app and so many are open to learning about new brands and products means it should still be high on your advertising agenda.
What’s more, the platform’s vast global reach makes it ideal for companies with diverse target audiences.
Further reading: Timing is key to achieving high engagement rates on Instagram and other social media advertising platforms. Get organized for the year ahead with our article on How to Build a Social Media Content Calendar.
X Advertising Statistics
X has had an interesting journey since its high-profile takeover by billionaire Elon Musk. So should the app formerly known as Twitter still be on your advertising radar?

Here’s what the data tells us:
- X ads have a potential reach of 528.3 million active users (X, 2023)
- The average X user spends 34.8 minutes per day on the platform (Khoros, 2022)
- 64.3 of X’s ad audience identifies as male and 35.7% identifies as female (Kepios, 2023)
- 82% of B2B businesses use X (Khoros, 2022)
- 77% of X users have a better impression of a brand when they respond to a post (Khoros, 2022)
- In 2022, ad engagement on X increased by 32% YoY (Khoros, 2022)
X’s profile count may have decreased since rebranding, but it’s clear the platform still has the power to engage specific types of users.
The competition for attention is high, especially among B2B businesses. But if X’s largely male audience fits your ideal customer profile, persuasive ad content can still drive sales.
Further reading: X ads work best as support for an ongoing search engine optimization (SEO) strategy. Learn how to increase visibility on the platform in our guide How to Build a Twitter SEO Strategy.
TikTok Advertising Statistics
TikTok’s rapid rise in popularity makes the channel difficult to ignore for online advertisers. Especially since it offers a wide range of ad formats and targeting options.
Here are some facts and figures on TikTok’s online advertising potential:
- TikTok has the third-largest reach of all social media advertising platforms in the U.S., with more than 150,000,000 users (TikTok, 2023)
- On average, TikTok users open the app eight times per day (Khoros, 2022)
- Users spend an average of 23.6 hours per month watching TikTok content (We Are Social, 2022)
- TikTok users are 1.5x more likely to immediately purchase something they discovered on the platform compared to other social media platform users (Khoros, 2022)
- TikTok users are 1.5x more likely to convince a friend or family member to buy a product they’ve seen on the app (Khoros, 2022)
- 36.2% of TikTok users are under the age of 25 (Statista, 2023)
The fact that TikTok users spend so much time on the app makes it a solid choice for placing video ads. Especially for companies targeting Gen Z consumers (those born between 1997 and 2012).
Providing instant gratification through short, impactful clips is the best way to succeed on TikTok.
Given how little time you’ll have to gain user trust, try complementing your ads with some influencer marketing. That way, you can borrow the trust and followings of high-profile users in your field.
Further reading: With so much fresh content available to users, standing out on TikTok can be tough. Learn what works in our blog post exploring The Hooks of Viral TikTok Videos.
Snapchat Advertising Statistics
Snapchat is well known for its interactive and immersive ad capabilities. Its augmented reality filters, for example, offer plenty of creative potential for businesses.

Here’s what advertisers need to know about the ever-popular video messaging app:
- 375 million people use Snapchat daily (Snapchat, 2022)
- 75% of 13- to 34-year-olds in 20+ countries are on Snapchat, along with 90% of 13- to 24-year-olds (Snapchat, 2022)
- The average Snapchat user opens the app more than 30 times a day and spends more than 30 minutes on the app (Snapchat, 2020)
- After watching ads on Snapchat, users are 45% more likely to recommend the advertised brand to their friends, and 34% more likely to purchase the products advertised (Snapchat/Neuro-Insight, 2022)
- 64% of Snapchat ads are viewed with sound on (Snapchat, 2020)
Snapchat might not be first on your list of prospective advertising channels. Especially if you don’t use the app yourself. But data shows it’s an option worth exploring for companies with young target audiences.
Given how often users interact with the app, short and frequent ads give you the best chance of being noticed. Vary your ad formats to reach different users in different ways.
Further reading: Snapchat is a versatile advertising platform with various formats available. Learn which are most likely to help you achieve your goals by reading our study on The Most Popular Types of Digital Ads.
LinkedIn Advertising
LinkedIn was made for business-to-business (B2B) marketers and advertisers. It’s one of the most effective ways to reach professionals across industries.

Here’s what you need to know about the current state of advertising on LinkedIn:
- LinkedIn has a potential ad reach of more than 950 million users worldwide (LinkedIn, 2023)
- 60% of LinkedIn’s advertising audience is in the 25- to 34-year-old range (Statista, 2023)
- Only 2.9% of LinkedIn’s advertising audience is older than 55 (Statista, 2023)
- The average LinkedIn user spends 7.5 minutes per day on the platform (Khoros, 2022)
- 57% of LinkedIn traffic is through mobile devices (Khoros, 2022)
LinkedIn won’t suit all marketing objectives. But it’s a great place for ad content targeting decision-makers.
It’s not all about selling products, though. With so many young professionals on the site, you can also use LinkedIn ads as part of your recruitment strategy. The platform even has a dedicated page for its “Work With Us” ads.
Further reading: Get inspiration and ideas for grabbing attention on LinkedIn with our post 13 LinkedIn Marketing Strategies You Wish You Created & Why They Work.
Video Advertising Statistics
Online video consumption has grown massively over the past decade, to the point where many studies put it ahead of traditional TV in terms of engagement.

Image Source: Marketing Charts
But how does it stack up for advertising? Really well, according to this data:
- Advertising (57%) is the second most common reason for marketers to create video content, after presentations (65%) and before explainers (47%) (Biteable, 2021)
- As for what works:
- 81% of marketers say their videos perform better with music
- 66% say their videos perform better with a voiceover
- 64% say their videos perform better with captions
- 78% say their videos perform better with less text
- 65% agree it’s “very” or “extremely” important to show diversity in videos (Biteable, 2021)
- Social video advertising spend is expected to reach $79.28 billion in 2024 (Insider Intelligence, 2022)
- The cost of advertising on Netflix dropped $12.45 per thousand impressions (CPM) from Q4 2022 to Q4 2023. The cost of advertising on Disney+ dropped $3.36 (Insider Intelligence, 2023)
With ad costs dropping and production tools more accessible than ever, video advertising is an increasingly appealing option for marketers at all levels.
Unsurprisingly, the stats show video and audio go hand in hand to create the most engaging ad content. Using a mix of music and narration across your videos should get you the best results.
Further reading: Creating video content for the first time can be daunting, but there are tools to simplify the process. We recently unveiled our new all-in-one Video Marketing Platform.
YouTube Advertising Statistics
More than a video hosting site, YouTube is where billions of people turn daily for information and entertainment.
And given only 80 million (at the last official count) have ad-free Premium accounts, we can infer that the vast majority consume ad content regularly.

So where does it sit in the advertising landscape? Here’s what the data says:
- YouTube has a potential ad each of 2.53 billion users worldwide—almost a third of the population (Kepios/DataReportal, 2023)
- 84% of U.S. adults living in urban areas, 81% of those living in suburban areas, and 74% living in rural areas report using YouTube (Pew Research, 2021)
- Users spend an average of 23.2 hours per month watching the YouTube app (We Are Social, 2022)
- 59% of YouTube viewers think YouTube ads are more relevant to their interests than those on television or streaming services (Google, 2022)
- YouTube viewers say they’re 2x more likely to buy something they saw on YouTube (YouTube, 2020)
- 70% of YouTube viewers have bought from a brand after seeing its content on YouTube (Google, 2020)
The platform’s vast reach and engaged user base make YouTube one of the best places to distribute video ad content.
The data above shows viewers are open to branded messaging, so long as it’s relevant to them. Use the channel’s targeting features to reach the right people at the right moments, and you have a much better chance of boosting sales.
Further reading: Understanding what people are searching for on YouTube can help you create relevant and engaging ad content. Learn more in our guide on Finding and Using YouTube Search Trends to Boost Your Channel.
Pay-Per-Click (PPC) Advertising Statistics
PPC is a great way to target specific audiences and get fast results. It’ll get you in front of users on social media, search engines, and online marketplaces. And with minimal financial risk, since you only pay when someone clicks through to your content.

Here are some key statistics about PPC:
- The top 10 most popular platforms for running PPC campaigns are:
- Google (98%*)
- Facebook (76%)
- Instagram (64%)
- Bing (60%)
- YouTube (59%)
- LinkedIn (42%)
- Pinterest (15%)
- TikTok (15%)
- X (formerly Twitter) (14%)
- Amazon (11%)
*Percentages show how often a platform was part of survey respondents’ digital advertising strategies (TrueClicks, 2022)
- 42% of marketers spend less than $50K/month on PPC, 39% spend between $50K and $500K, and 18% spend more than $500k/month (TrueClicks, 2022)
- 97% of PPC freelancers and specialists have adopted Responsive Search Ads in Google; 81% have adopted Responsive Display Ads (TrueClicks, 2022)
- 71% of those using Responsive Search Ads in Google were satisfied or neutral about the results. 66% of those using Responsive Display Ads in Google were very satisfied, satisfied or neutral about the results. (TrueClicks, 2022)
- Based on TrueClicks' State of PPC 2022 survey responses, PPC professionals spend most of their time on:
- Search query mining
- Reporting
- Writing ads
- Budget management
- Campaign creation
- Ad testing
- 45% of PPC professionals use Semrush for competitive analysis (TrueClicks, 2022)
- 31% of PPC specialists use AI writing assistants to craft ad copy, with the most popular tool being Grammarly (17%) (TrueClicks, 2022)
While Google dominates the PPC market, advertisers continue to run successful campaigns on other platforms.
So there’s an opportunity to get your brand and products in front of your audience wherever they spend the most time.
The data also shows PPC specialists are quick to adopt new, helpful features. Keep an eye on your preferred channels’ announcements for fresh opportunities to increase engagement.
Further reading: New to PPC? Our Definitive Guide to Pay-Per-Click Marketing is the best place to start learning.
Google Ads Statistics
Google dominates search, which means it also dominates search advertising. That alone makes it impossible for marketers in all industries to ignore.

Here are the latest stats on Google Ads:
- Search advertising revenue reached $84.4 billion in 2022—making up 40.2% of total internet advertising revenues (IAB, 2023)
- Google is the most-used platform for PPC advertising (TrueClicks, 2022)
- The average Google Ads click-through rate across all industries is 6.11% (Wordstream by LocaliQ, 2023)
- The average Google Ads cost per click (CPC) is $4.22 (Wordstream by LocaliQ, 2023)
- The average Google Ads conversion rate is 7.04% (Wordstream by LocaliQ, 2023)
- The average cost per lead on Google Ads is $53.52—it’s risen nearly 20% year-on-year (Wordstream by LocaliQ, 2023)
- Arts and entertainment businesses experience the lowest average CPCs ($1.55), while attorneys and legal services have the highest ($9.21) (Wordstream by LocaliQ, 2023)
- Career & employment companies pay the highest average cost per lead ($132.95), while automotive repair and service firms have the lowest ($21.12) (Wordstream by LocaliQ, 2023)
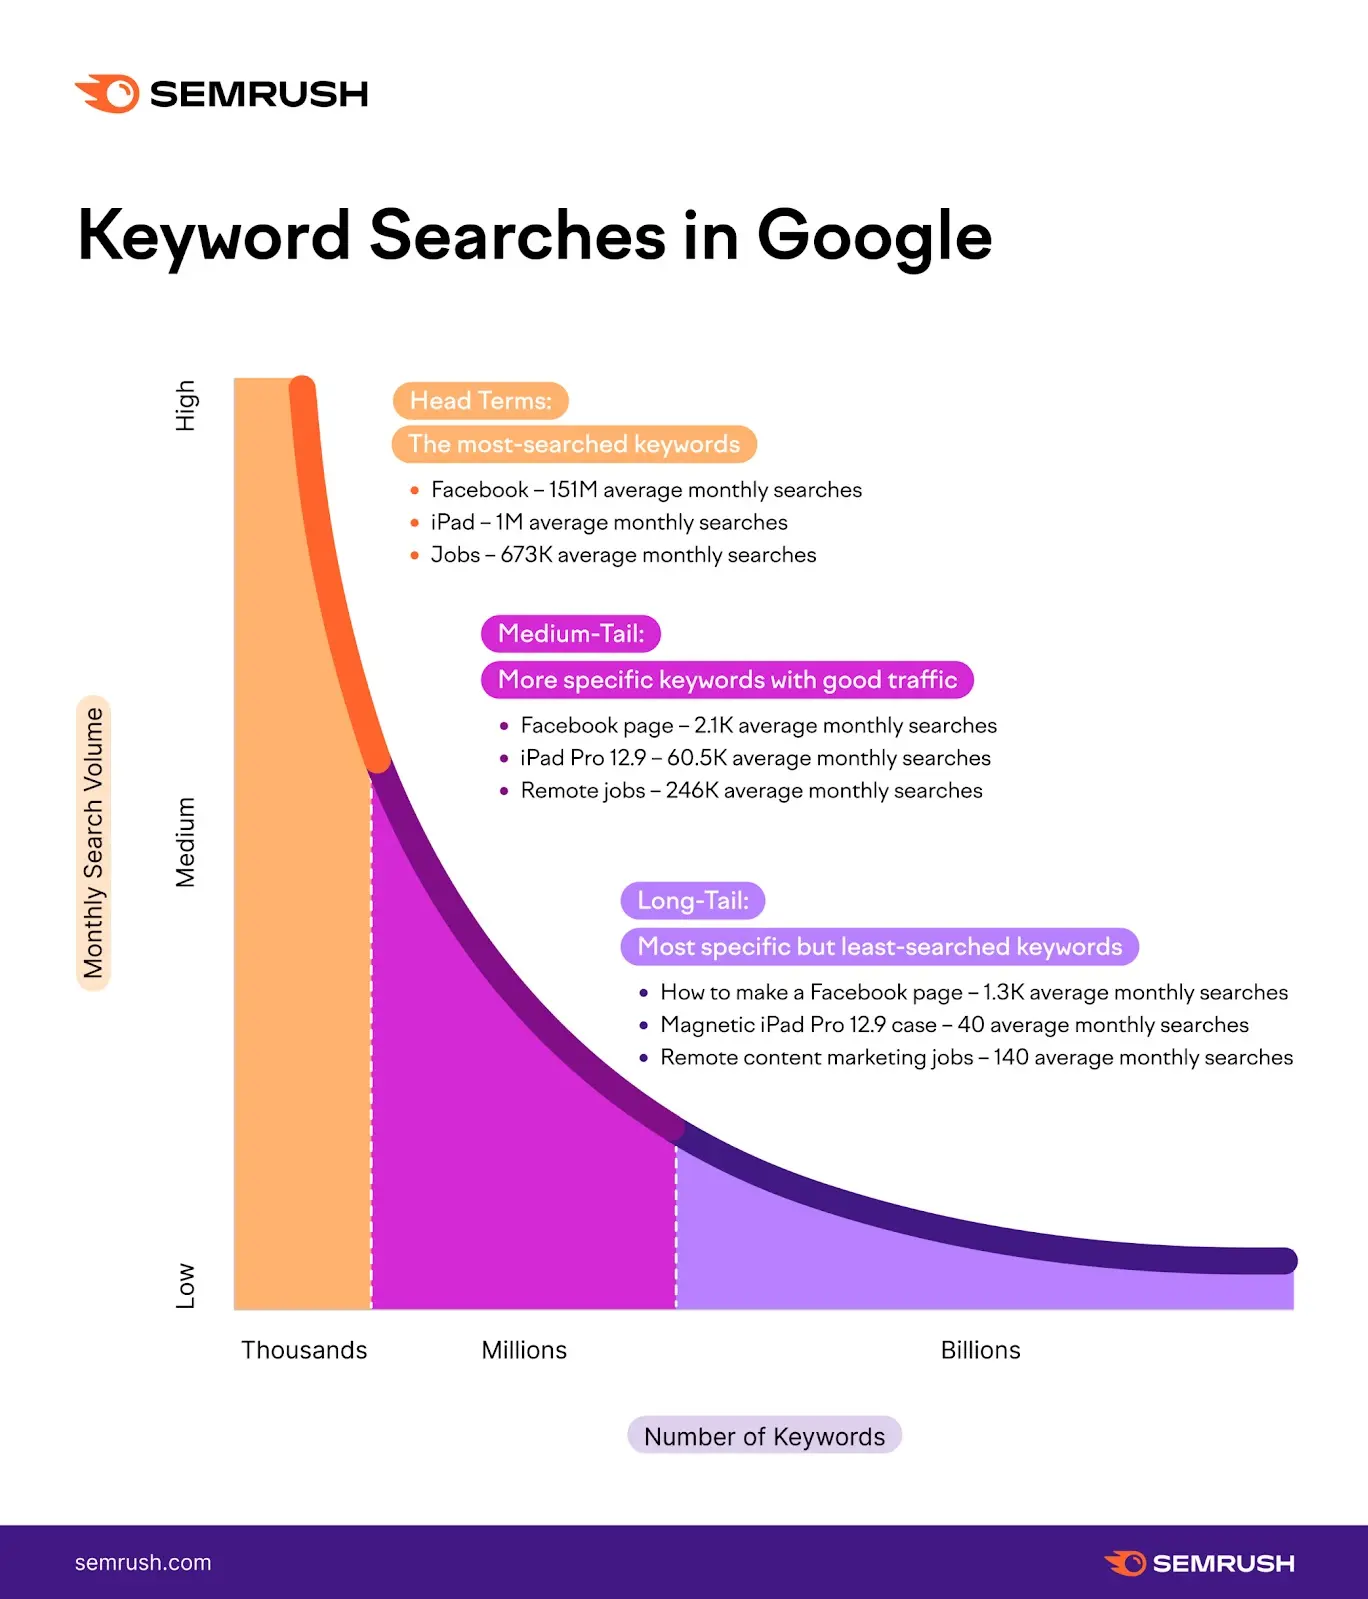
- Long-tail keywords, in aggregate, make up the vast majority of all Google searches (Semrush, 2022)
With search advertising getting more expensive, it’s more important than ever to carefully build your Google Ads strategy. Companies that rush their campaigns and hope for the best could waste their budgets on disappointing results.
The key to Google Ads success and cost-effectiveness is thorough planning. There are plenty of valuable tips on this in our knowledge base article on PPC Keyword Research.
Further reading: If the statistics above inspire you to try Google’s ad platform for the first time, you’ll want to learn the basics and more in our Comprehensive Guide to Google Ads.
The State and Future of Online Advertising
Looking ahead to the future of advertising can help you spot early opportunities to get more value from your ad spend.
The stats below give us an idea of what to expect in the coming months and years.
- Ad spending is expected to show an annual growth rate (CAGR 2023-2027) of 4.53%, resulting in a projected market volume of $247.3 billion by 2027 (Statista, 2023)
- Internet advertising revenue is estimated to reach $723.6 billion by 2026—and all but $8.4 billion will come from the U.S. (PwC, 2022)
- 79% of CMOs agree with the statement “In a world where advertising is easier to ignore, it’s more important than ever to entertain and engage.” 58% say advertising doesn’t entertain enough. (Dentsu, 2023)
- 88% believe creative advertising has the potential to change society for the better (Dentsu, 2023)
- 87% of CMOs agree AI represents the future of advertising and marketing (Dentsu, 2023)
- 83% of CMOs say AI will allow human teams to be more creative and 86% agree it’ll improve efficiency (Dentsu, 2023)
- However, 75% believe Generative AI will never fully replace the essence of human creativity (Dentsu, 2023)
Further reading: Industry media is the best way to keep track of advertising trends across social media, search, PPC, video, and more. Keep an eye on the Semrush Blog for regular advice and updates.
Run Cost-Effective Online Advertising Campaigns with Semrush
Semrush has all the tools you need to plan, implement, and measure your online advertising campaigns.
Start getting more significant returns from your advertising budget today by signing up for a free trial account and getting full access for seven days.