Audience Intelligence provides key data insights into various social consumer segments, allowing you to engage with your social audiences in a more meaningful way. It is suitable for marketers and consumer research teams who want to develop an innovative and audience-centric approach to their social media marketing.
You can find it in the Semrush App Center.
How Can Audience Intelligence Help Me?
Audience Intelligence allows you to understand who your audience is and gain actionable, in-depth insights into their online behavior, helping you build a more effective social strategy. You can even discover new growth segments within your audience that you may not have been previously aware of, enabling you to personalize your messaging and improve engagement.
Audience Intelligence also lets you:
- Identify the most relevant media channels, platforms, and outlets to reach your audience at scale
- Understand your audience’s personality types and mindsets to better align your messaging
- Discover relevant influencers and media partners to enhance your brand’s reach
- Analyze your competitors to identify untapped audiences
- See how your audience engages with your competitors
Pricing
All Semrush users can view four different demo reports.
A paid subscription to the Audience Intelligence app is available from the App Center for $150 per month. It allows you to generate one report per month. On the 1st of each month, you can create a new report or refresh the existing one.
Additional reporting can also be purchased within the app:
- 1 extra report for $150 per month (i.e. $300 per month for 2 reports)
- 3 extra reports for $375 per month (i.e. $525 per month for 4 reports)
- 5 extra reports for $500 per month (i.e. $650 per month for 6 reports)
More information about Semrush pricing can be found here.
What’s Included in Audience Intelligence?
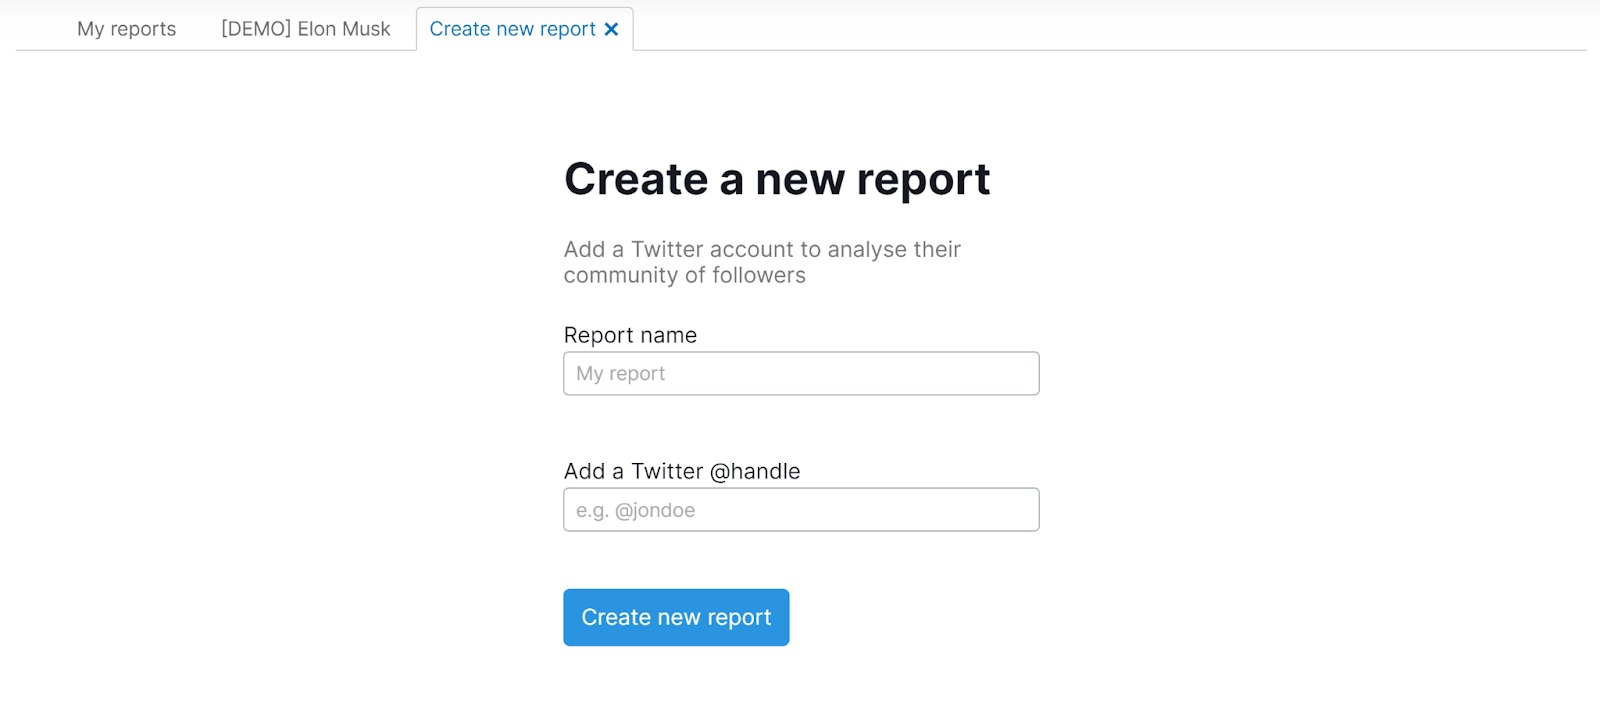
Your Audience Intelligence subscription entitles you to one report per month (although it’s possible to purchase more). To create a report, you will need to provide an X (Twitter) handle for the audience you want to research.
Each report consists of two primary sections to note: the Audience breakdown with the full audience and clusters, and the Report Insights where you can choose to view them for the full audience or individual clusters, including a comparative baseline feature.
Audience Breakdown—Cluster summaries
The Audience breakdown and cluster cards separate and visualize the most prominent communities within your wider audience, allowing you to uncover unique insights about what they care about and what trends connect them so you can finetune your targeting for these key groups.
Affinities segmentation breaks users out into clusters based on their unbiased interest behaviors due to their following patterns. Individual users are grouped into a single best cluster based on the handles they choose to connect with and their similarities.
Cluster names are generated with the help of AI based on how members within the cluster describe themselves, taking into account unique bio-keywords to distinguish each cluster from the rest of the audience, and who they follow to identify their interests.
AI-generated segment names consist of 2-3 words and emojis, and are always in English: i.e., Pop Music Lover 💜 or Soccer and WWE Fan ⚽🤼♂️.

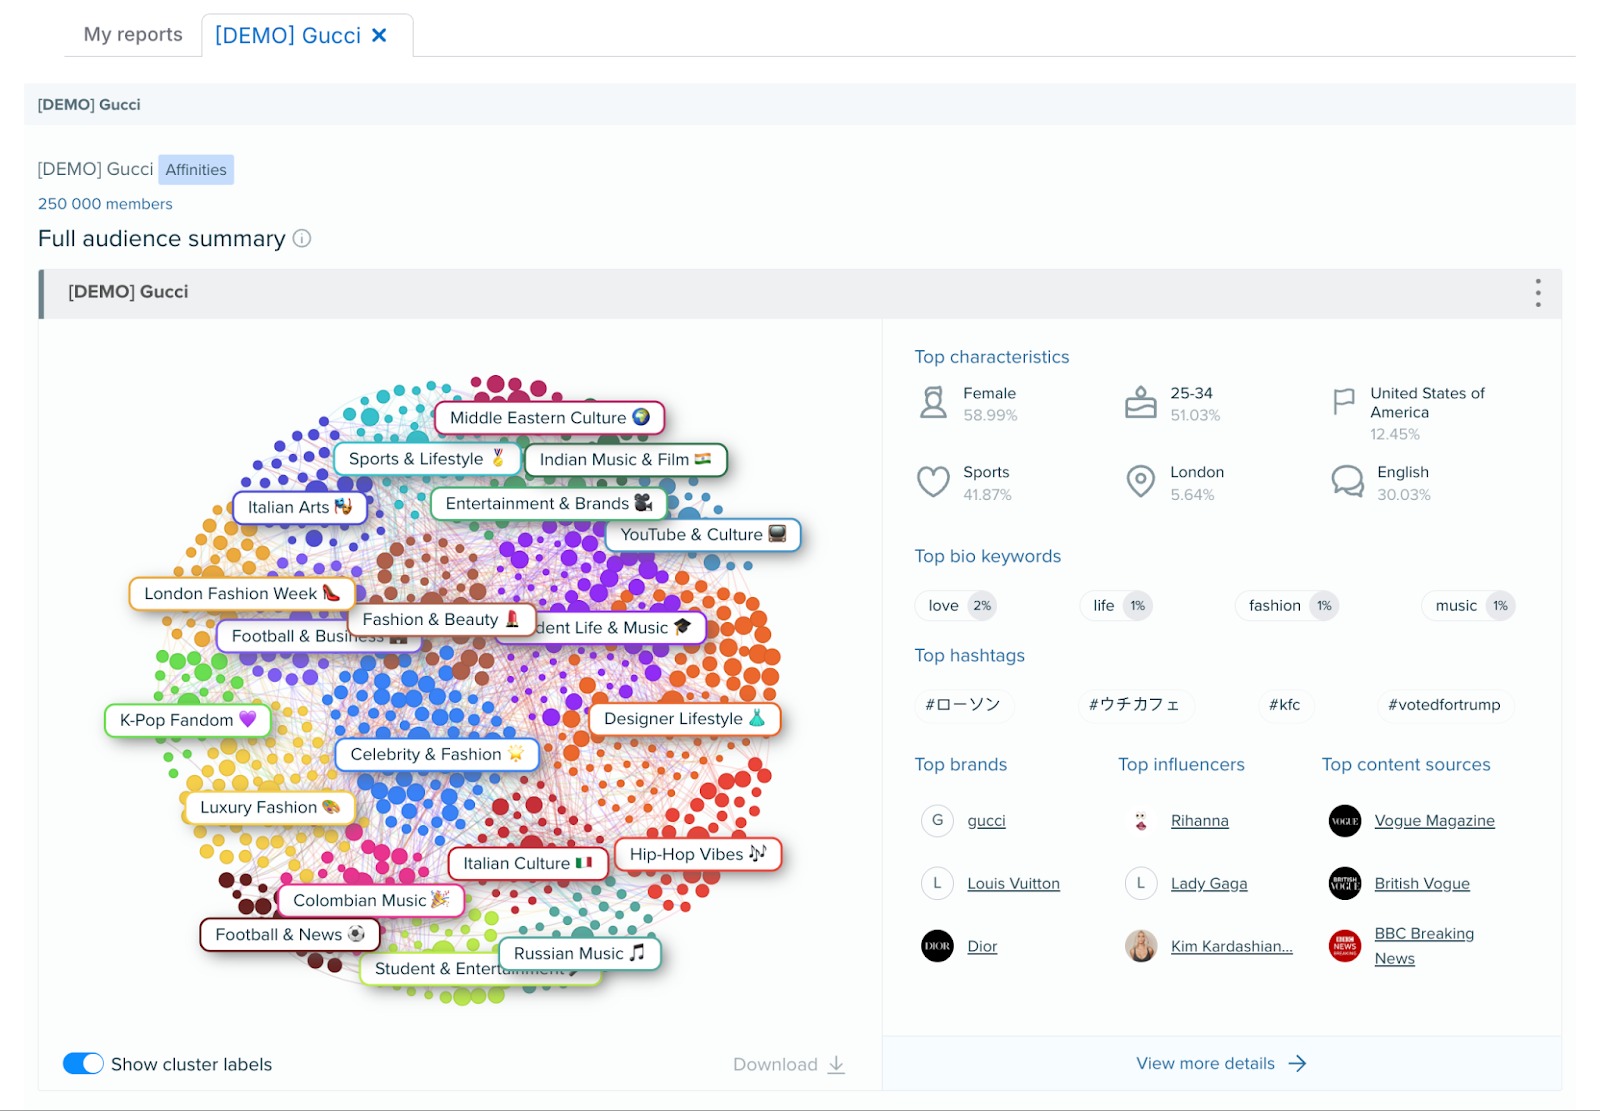
Interpreting visual data from the full audience summary:
- Cluster Size: Each cluster's size reflects the number of members within it. Larger clusters signify more members.
- Edges (Links): The lines between nodes (audience members and influencers) represent their connections. These could be interactions or relationships, such as follows or mentions.
- Node Size: Nodes represent individuals (audience members or influencers). The size of a node corresponds to the number of connections it has—larger nodes indicate more interactions.
In the interface, hovering over a cluster highlights its connections, allowing for deeper exploration of relationships and interactions within the audience.
As you scroll down, the cluster cards show the names, color identifiers, and summaries of each cluster. You can gain a closer understanding of the makeup of these clusters and compare them against each other (or against your wider audience).
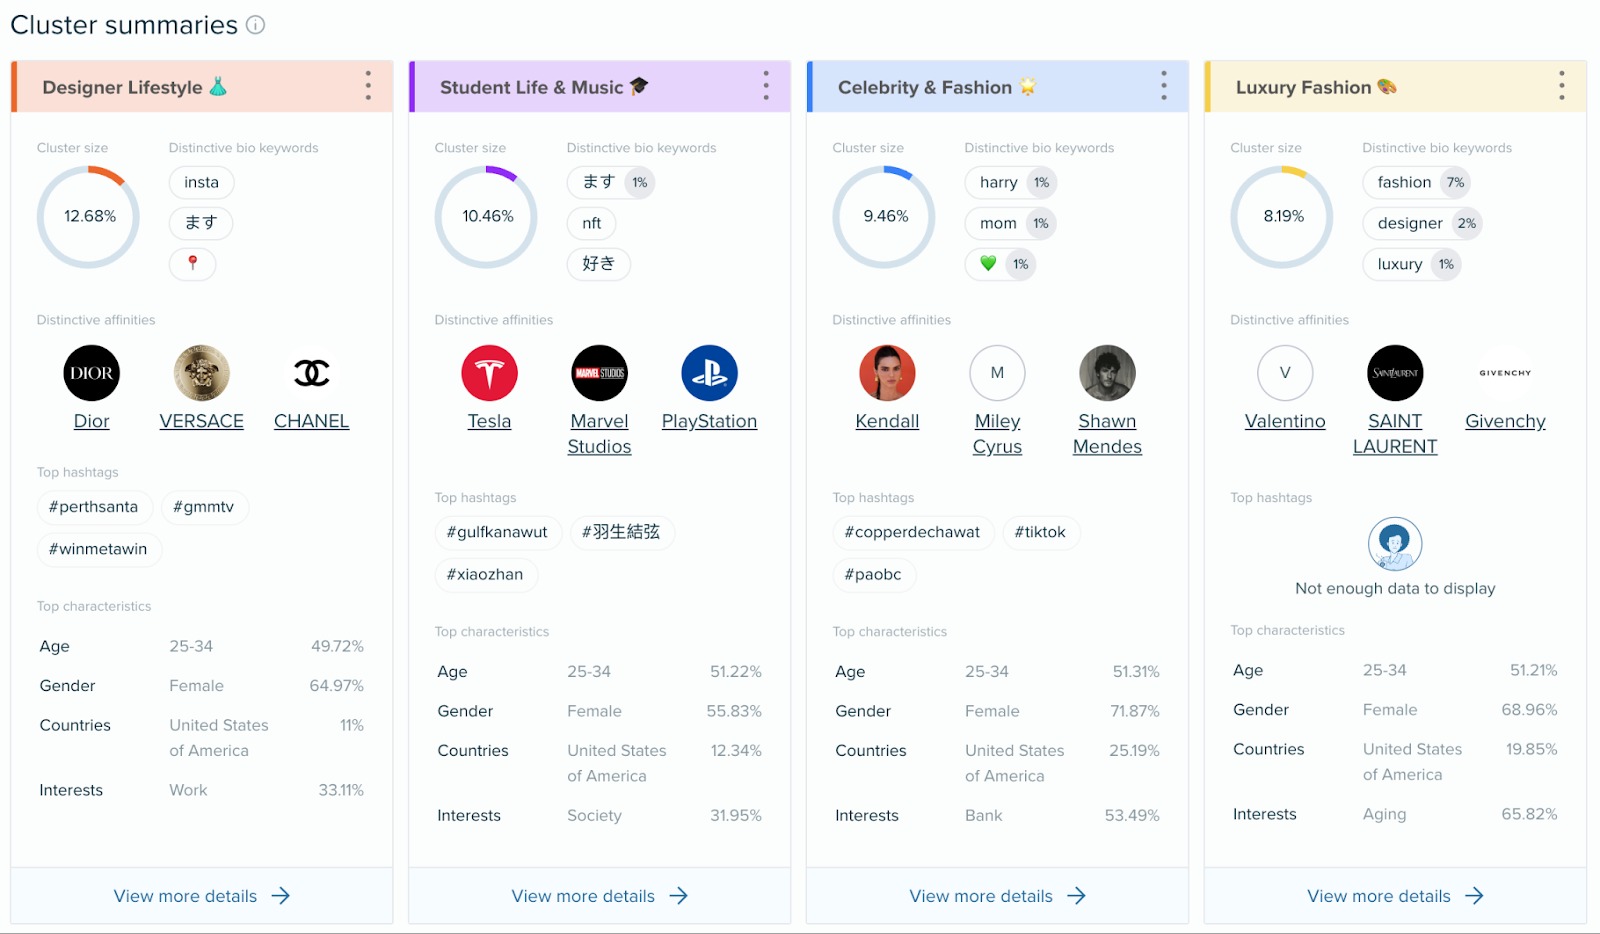
For instance, you can get a quick summary of:
- How these clusters define themselves (distinctive bio keywords)
- Their top sources of influence
- Their most used hashtags
- Their overall demographic tendencies
You can then click on “View more details” to navigate through the report insights in more detail.
Report Insights
The report dashboard contains nine tabs of in-depth data about your audience.
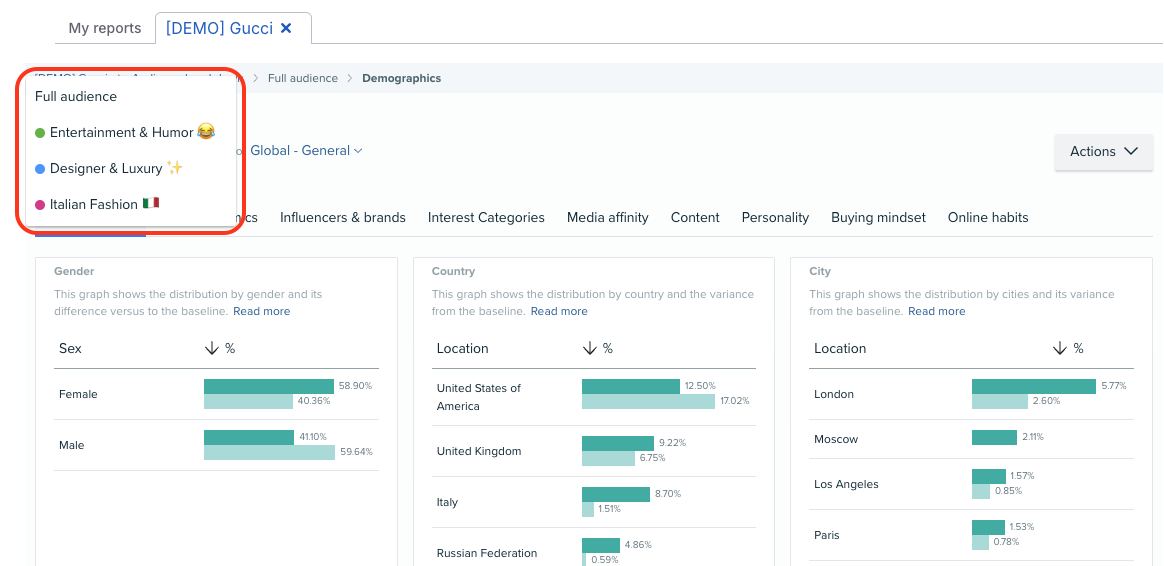
You can view data for your full audience (a sample size of up to 250,000 members) or select an individual cluster in the audience drop-down arrow on the top left-hand corner.
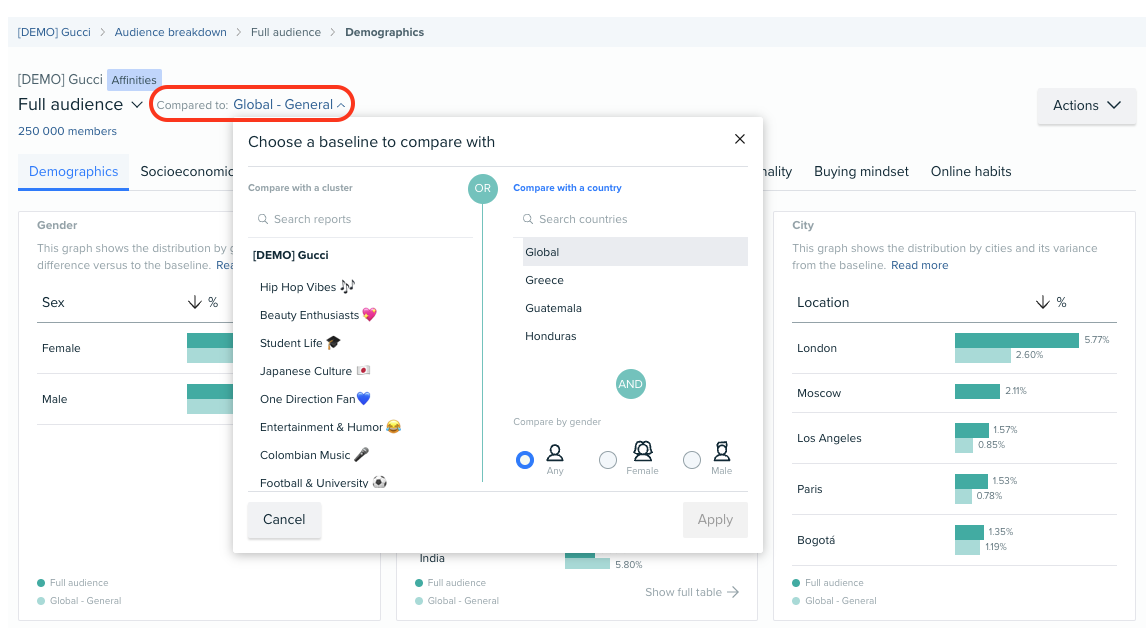
Note that for each data point, the app also provides a baseline for comparison. You can compare against the national or global average, or against the most prominent segments of your audience (as well as by gender). This can help you identify any trends that are unique to your full audience (or audience cluster).
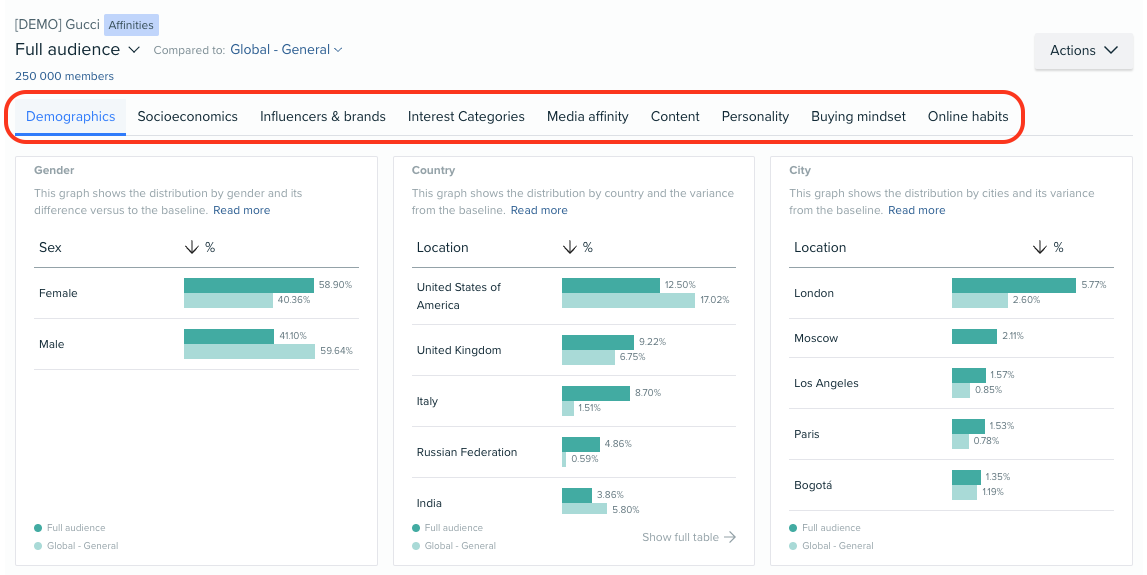
The dashboard provides the following nine tabs:
Demographics
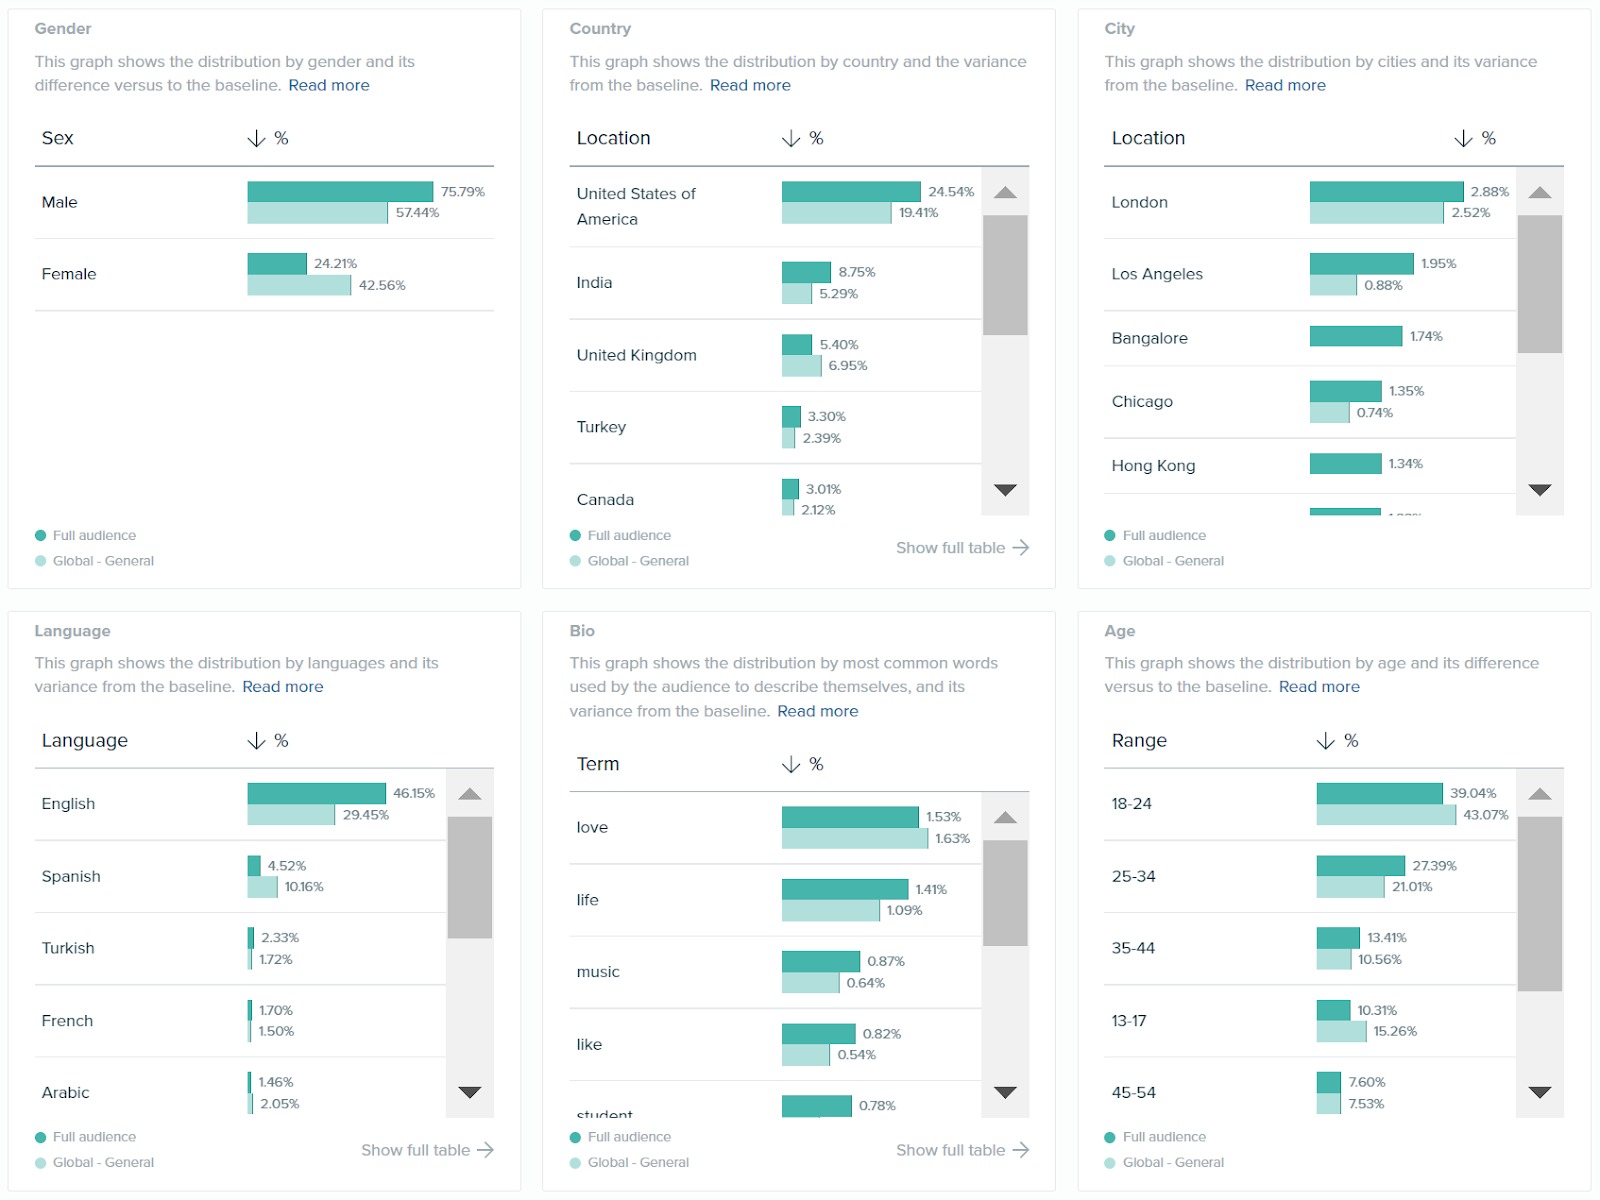
This report provides a closer look at the key demographic features of your audience. Specifically, it analyzes:
- Gender
- Top Country and city
- Language
- Age range
- Biography (represented by the most unique words used by your audience to describe themselves)
- Names within the audience (great when developing your personas)
Socioeconomics
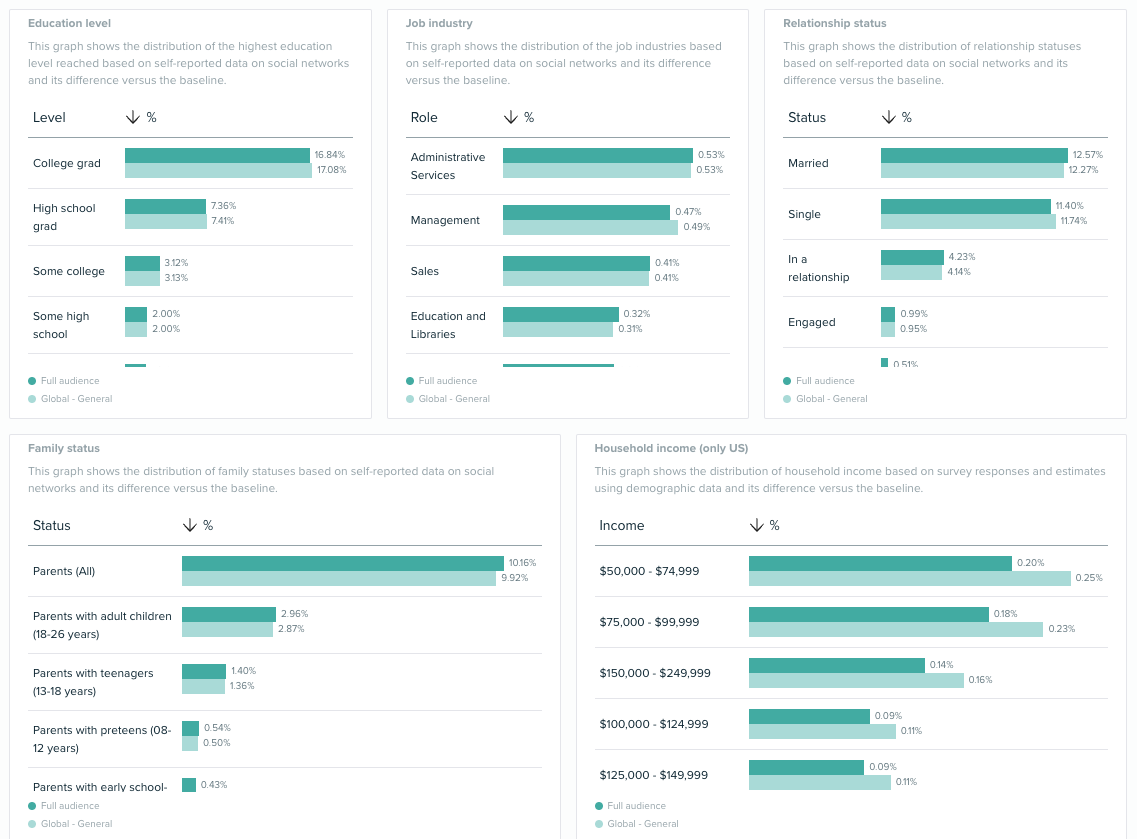
This report provides a socioeconomic breakdown of your audience, provided by Meta (integration). It analyzes:
- Education level
- Job type (by industry)
- Relationship status
- Family status
- Household income (U.S. only)
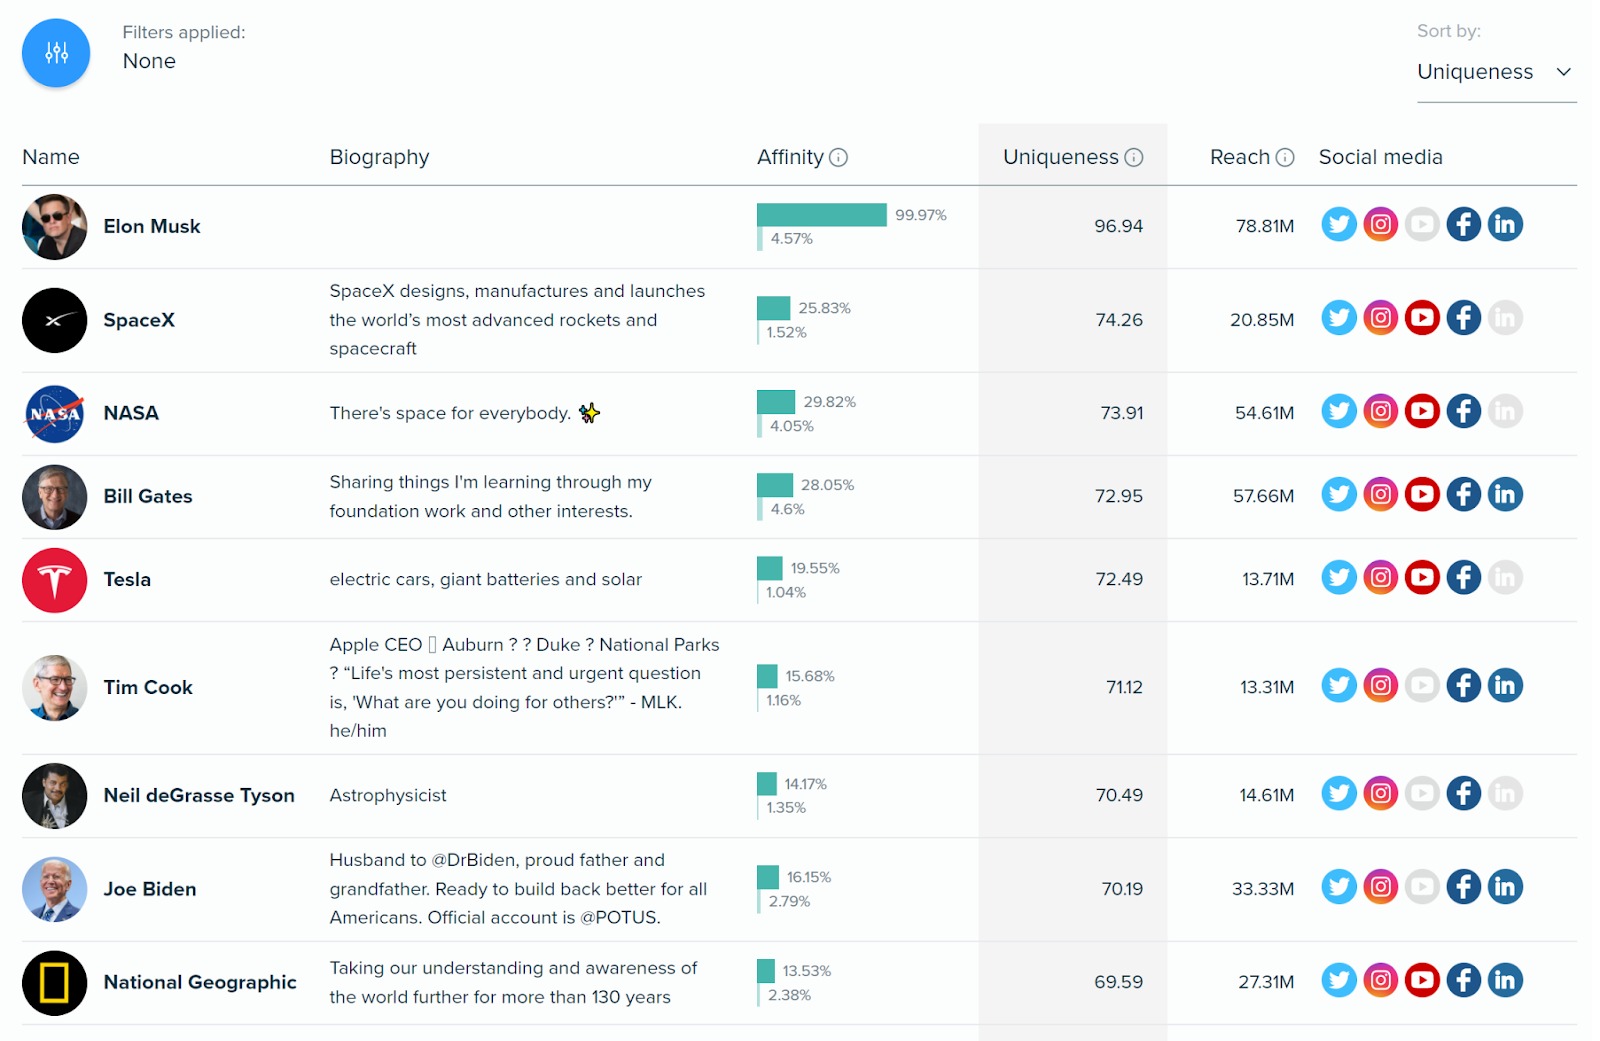
Influencers and Brands
This report provides an extensive list of up to 20,000 influencers and brands that your audience follows. You can order this list based on:
- Uniqueness (set by default): A quantitative figure that identifies how relevant a brand or person is to your audience compared to the baseline chosen. For example, Tom Brady will have a higher uniqueness score for an audience of NFL fans than the general sports baseline. This allows you to identify more relevant influencers for your audience (who they really care about).
- Affinity: The percentage of your audience that follows a specific brand or influencer - here you will find big accounts like Ellen DeGeneres or Barack Obama (in order of who they follow and engage with the most).
- Reach: An estimation of the brand or influencer’s number of social media followers.
Interest Categories
The Interests tab displays a list of audience interests, ranked by the percentage of the audience interested in each category.
The table includes the category position in the ranking and a percentage of the audience compared to the selected baseline.
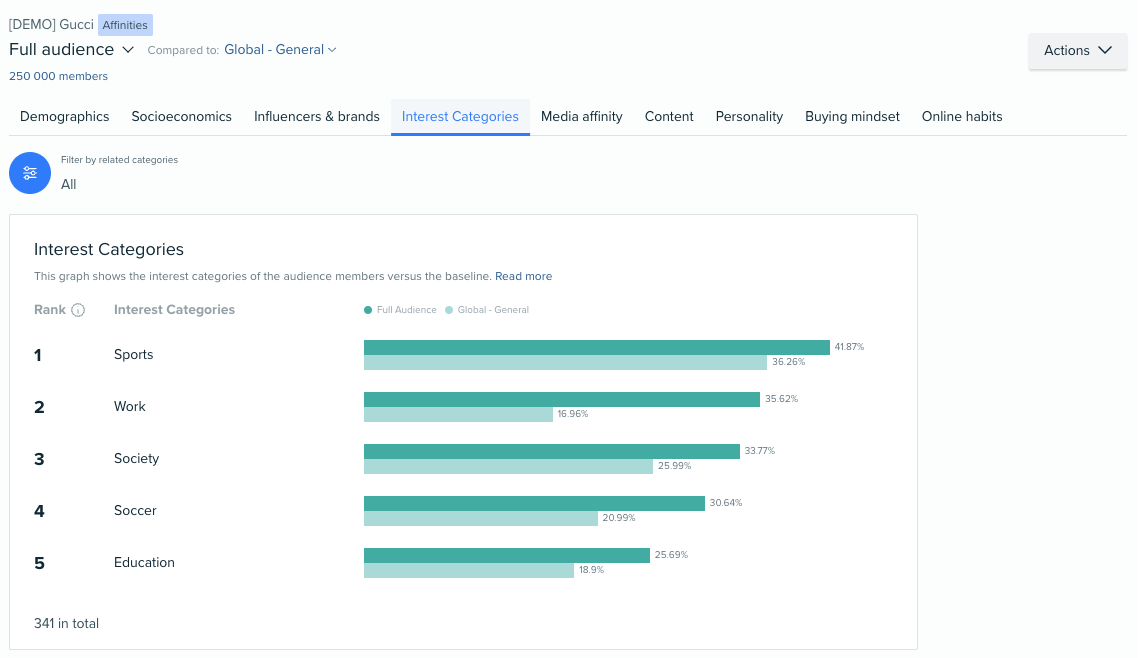
Although the IAB taxonomy organizes contextual content categories into tiers, in Audience Intelligence all interests, regardless of tier, are calculated for the entire audience analyzed. This approach ensures a mix of broader interest categories (e.g., music) and more specific ones (e.g., opera), reflecting whether an individual is interested in the general topic or a niche within it.
Filter by Group of Categories
Utilize the filter to identify interest categories related to a specific topic or explore interests around a particular theme. For instance, filtering by "Sports" allows users to focus solely on sports-related interests within the analyzed audience, minimizing irrelevant noise.
Please note that the ranking always displays the absolute position of the interests, even when filters are applied (helping you understand their true affinity towards an interest).
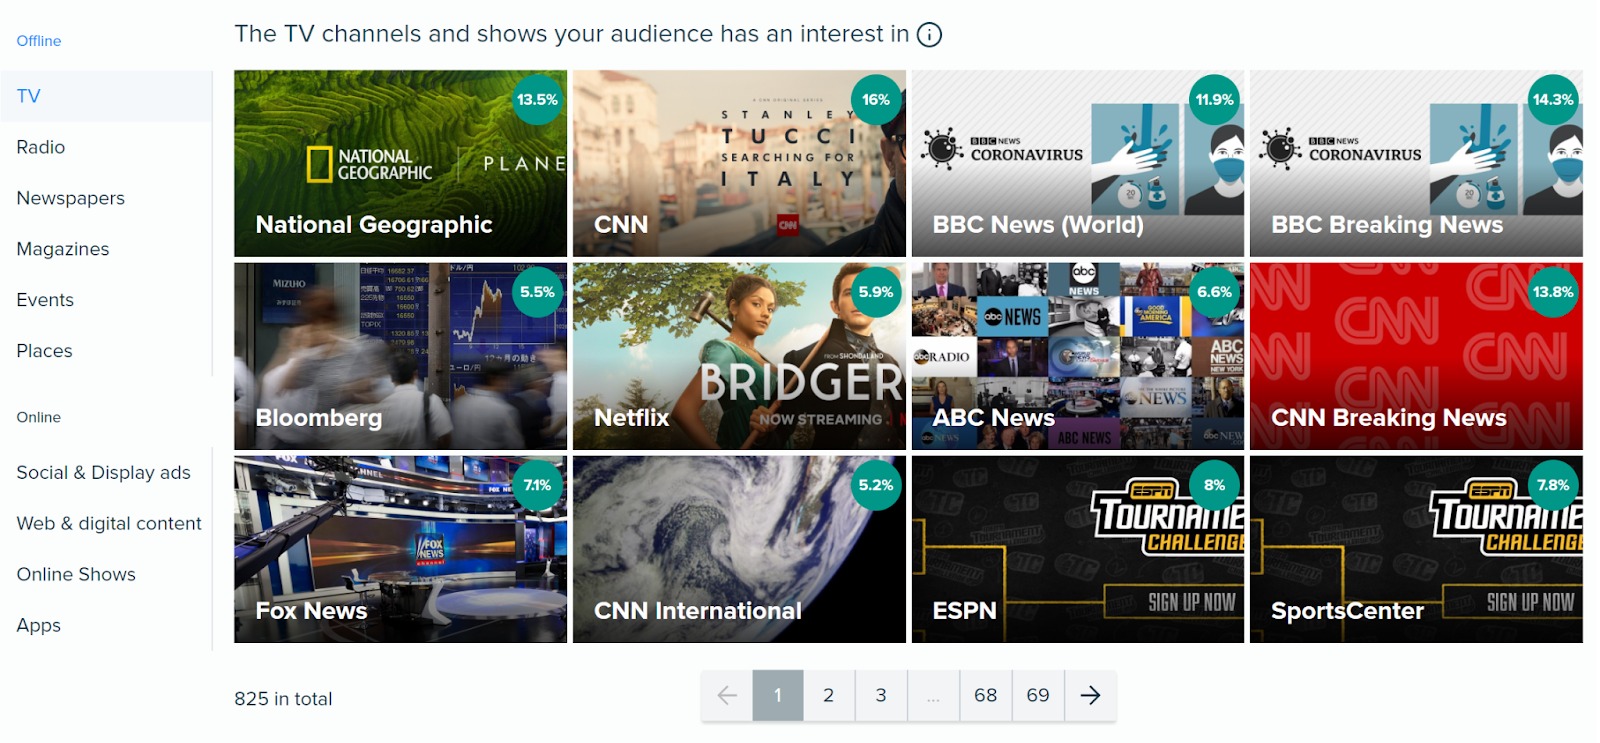
Media Affinity
This report visualizes the online and offline media that your audience is most interested in (as well as events and places that they visit). Specifically, you can analyze their preferences across:
- Television
- Radio
- Newspapers
- Magazines
- Events
- Places
- Blogs, websites, and other digital content
- Online entertainment (such as YouTube, Twitch, etc.)
- Apps
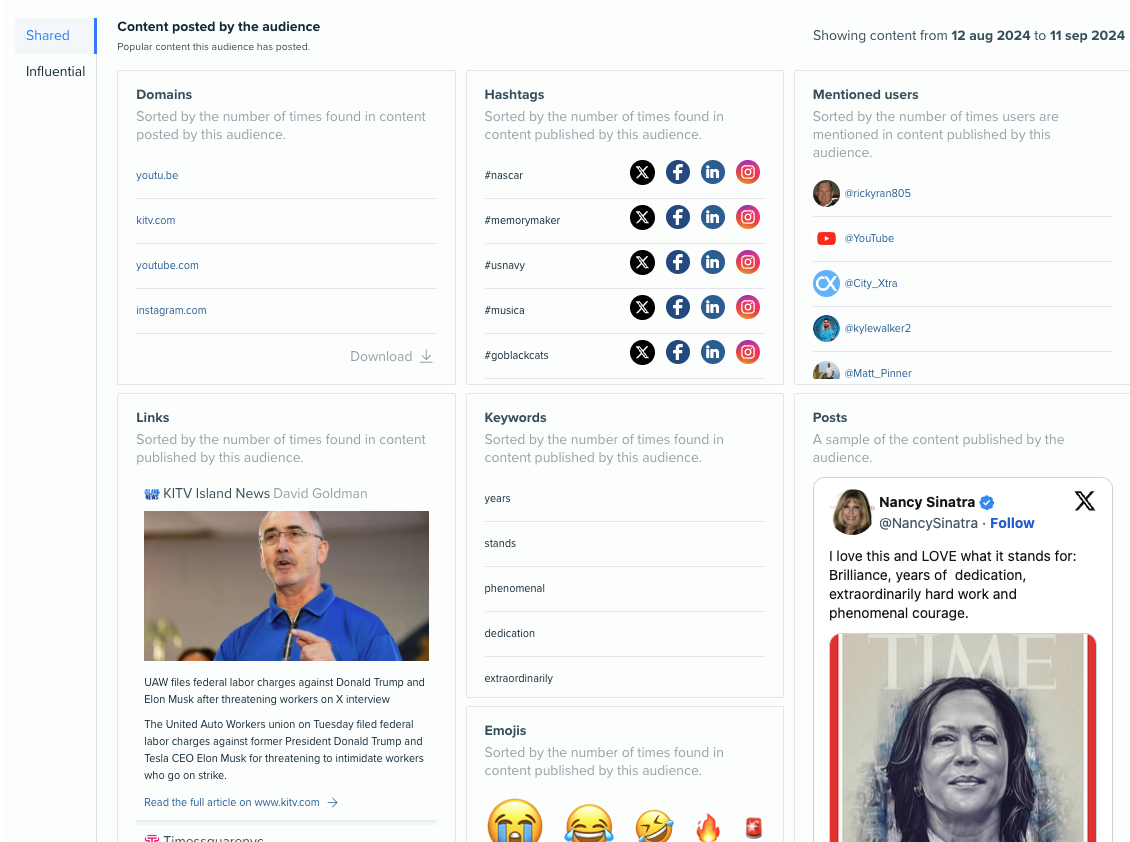
Content
This report breaks down the online content your audience has engaged with during the previous month.
Specifically, it focuses on three types of content:
- Shared content. Content that has been shared with the poster’s online community. The app analyzes the authors of original content within your selected audience segment and identifies their most popular posts.
- Influential content. Content that your audience is seeing on their own feed, as it is published by the accounts that they have an affinity with. It reveals what influencers are talking about and engaging with, and gives an idea of the content that they themselves are consuming and will be sharing amongst their followers.
Each of these tabs focuses on the following metrics, sorted by the number of times they appear in the analyzed content:
- Domains
- Hashtags
- Mentioned users
- Links
- Keywords
- Posts
- Media formats
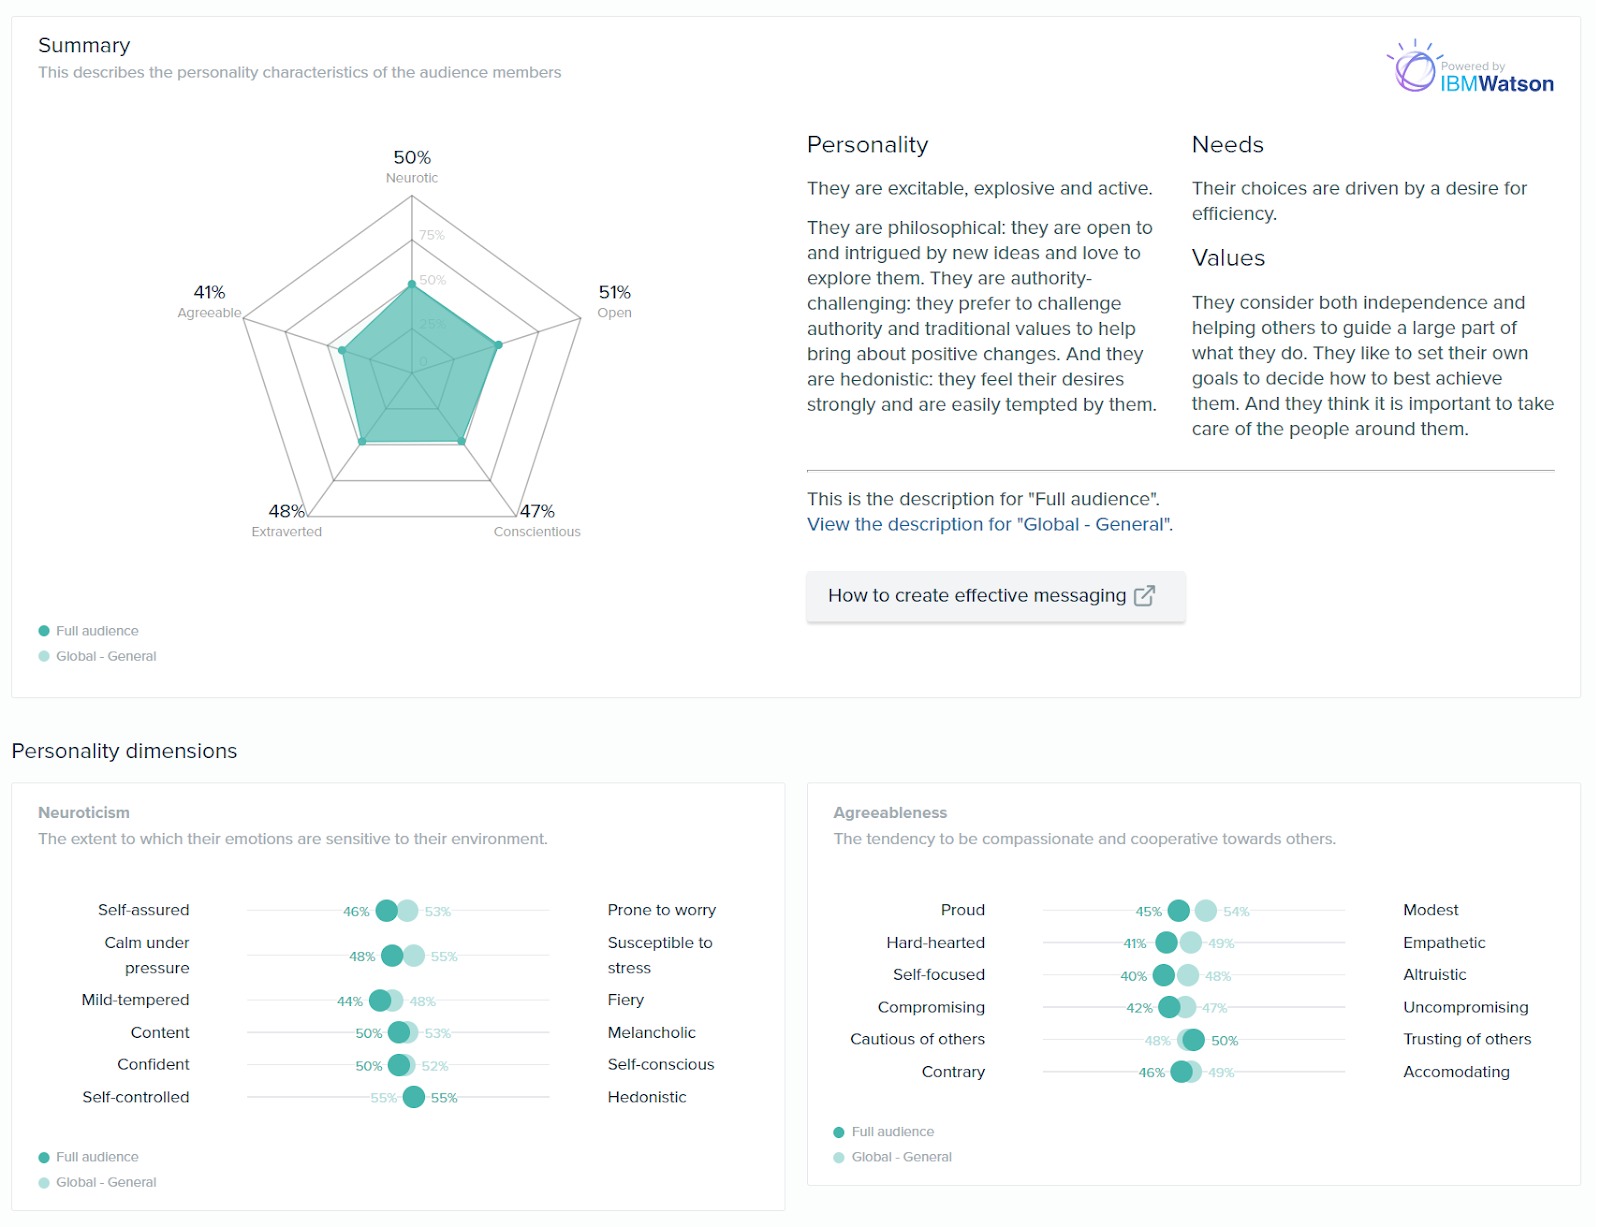
Personality
This report uses IBM Watson integration to analyze the personality characteristics of your audience, with a focus on the Big 5 Ocean personality types. You can review personality dimensions, needs, and values, as well as receive effective messaging advice tailored toward your audience’s personality scores.
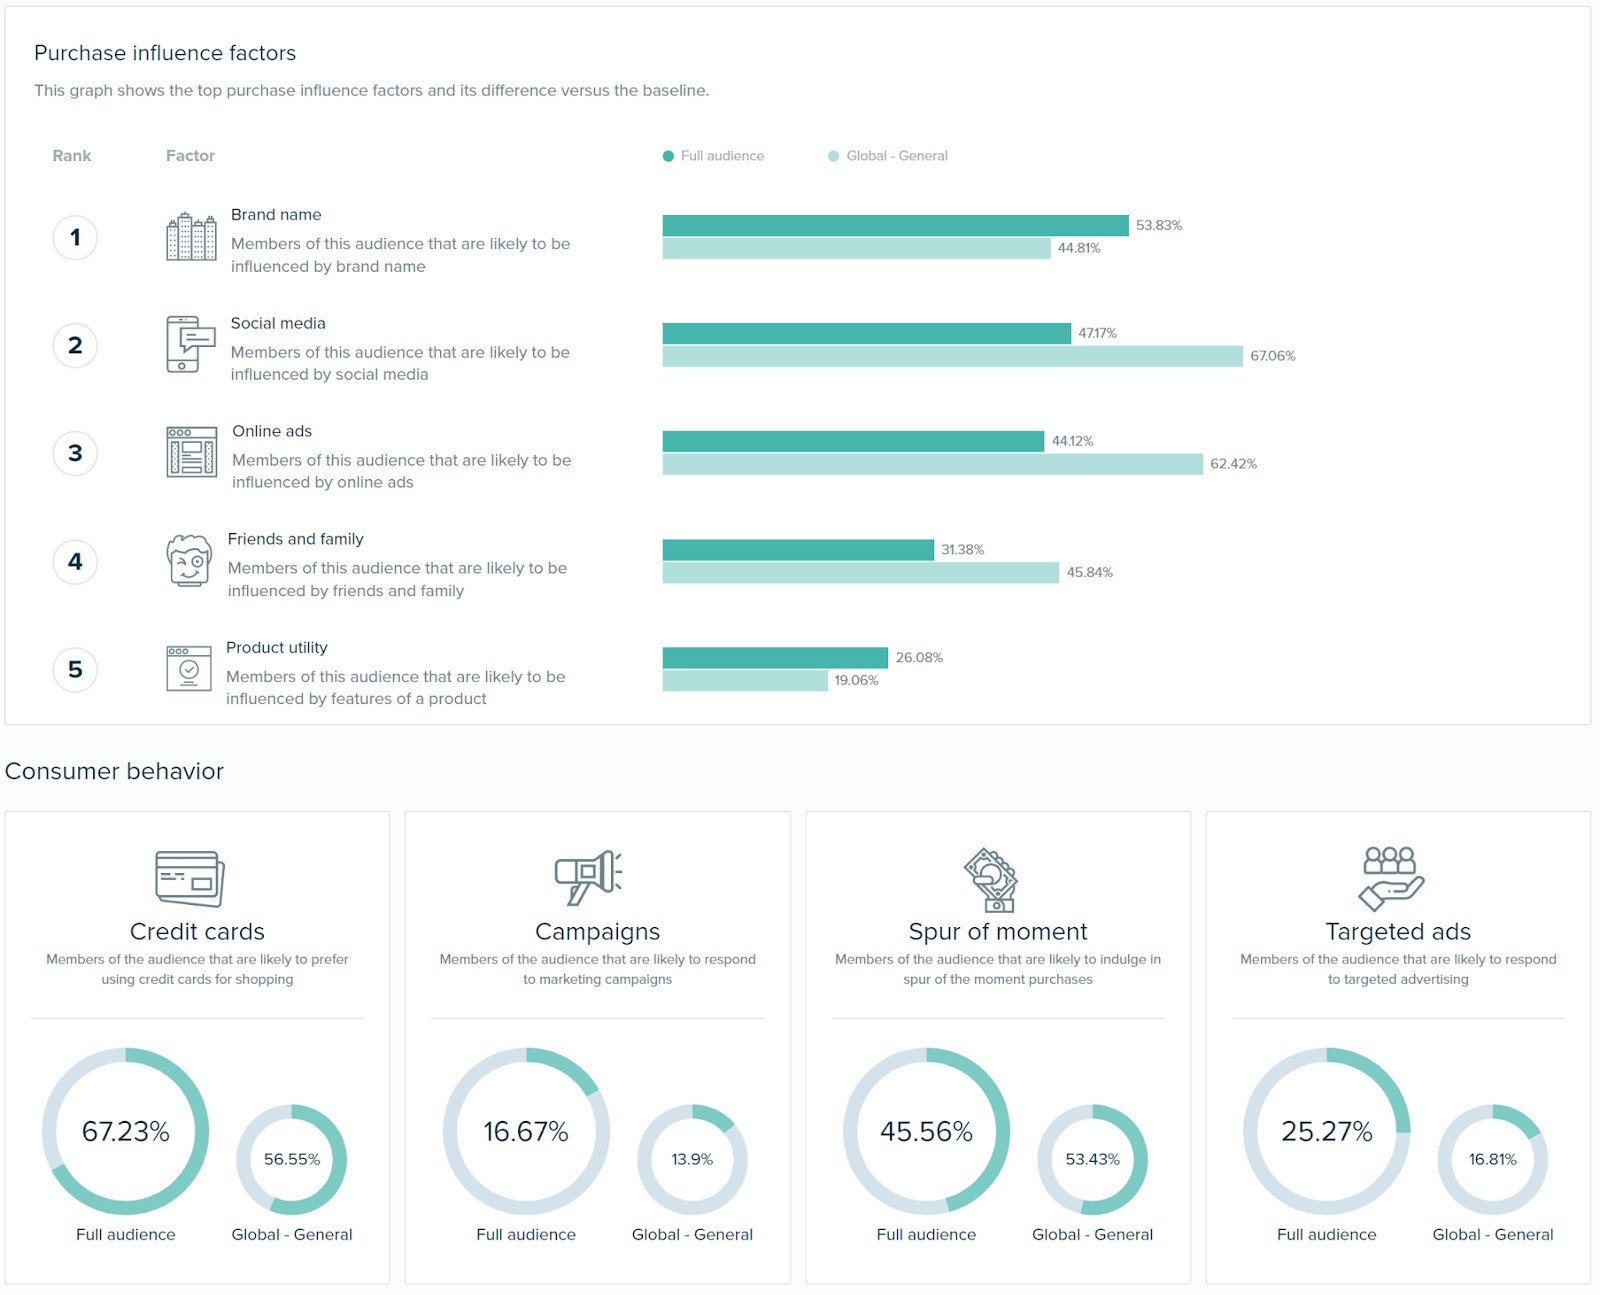
Buying Mindset
This report shows you the most influential purchase factors for your audience and offers a range of insights into their consumer behavior.
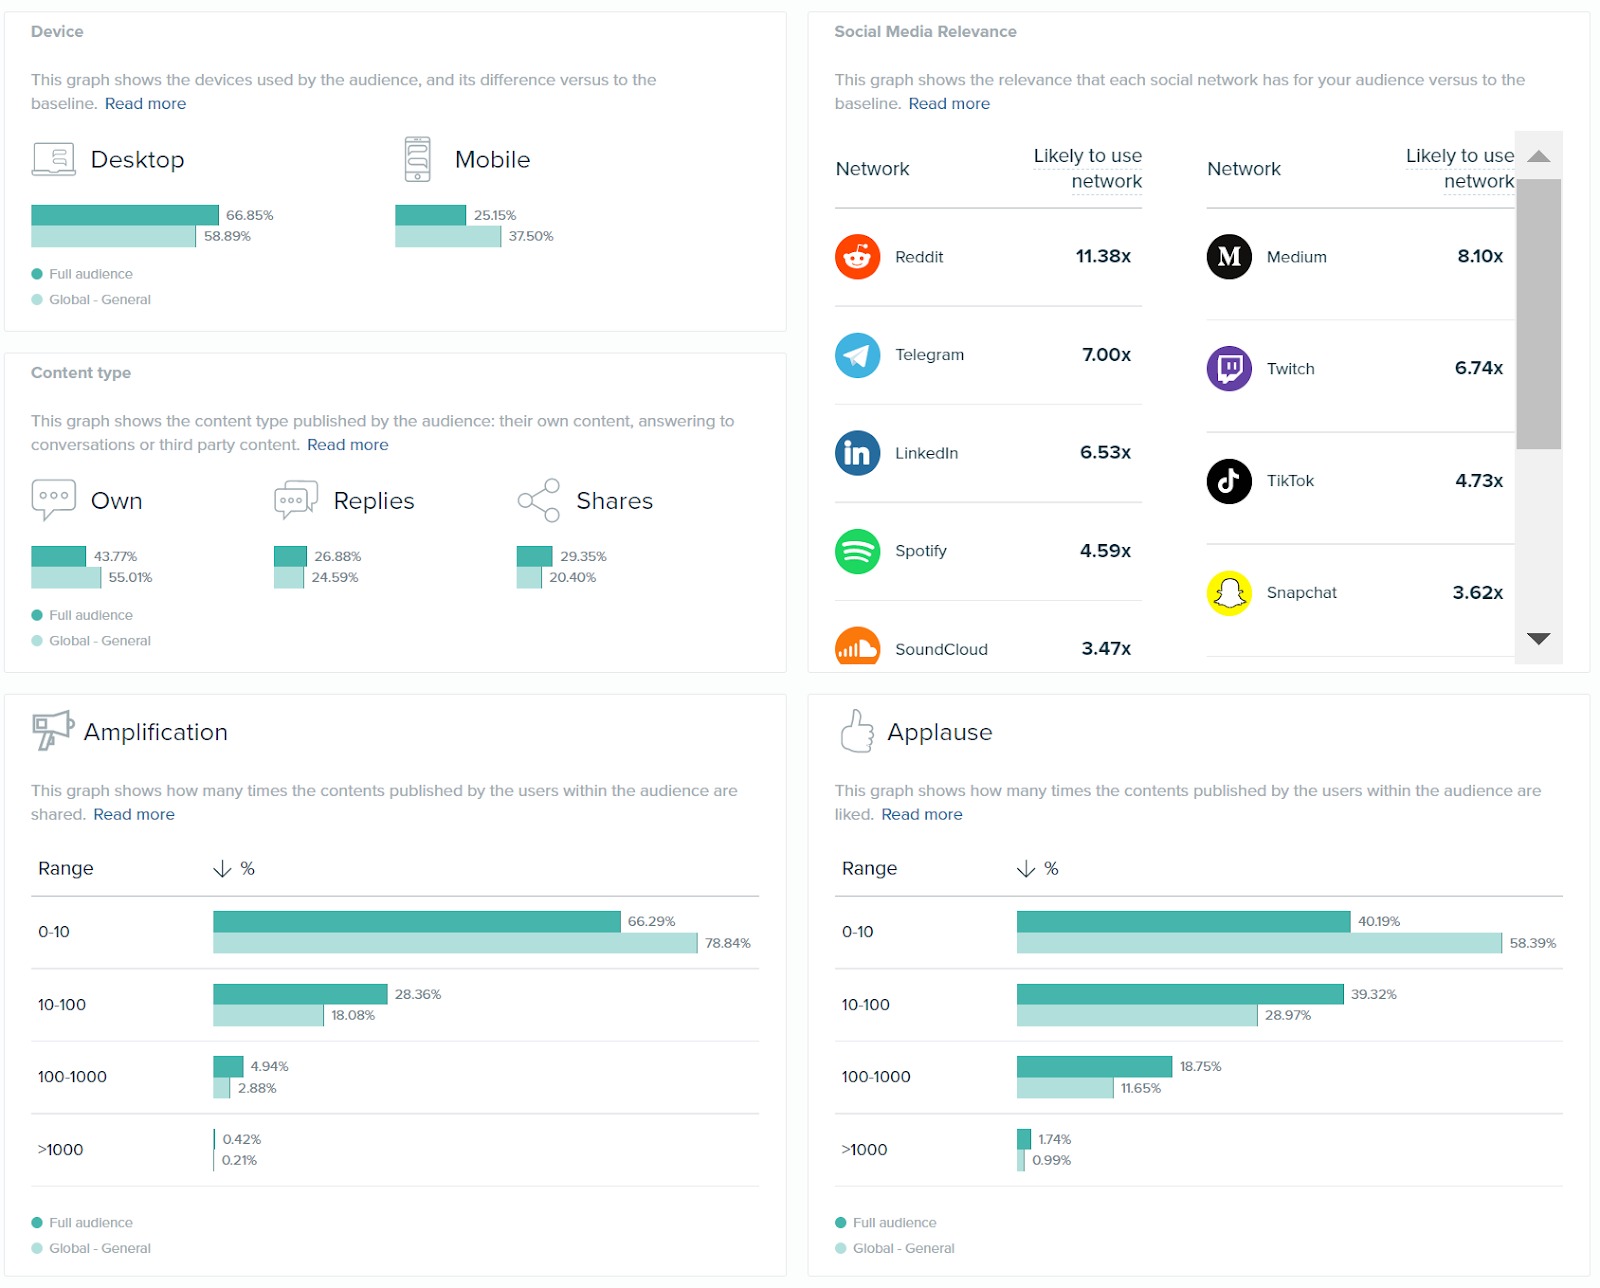
Online Habits
This report details the online habits of your audience, including:
- Which device they use
- Their most active time periods
- Their content publishing and engagement trends
- How likely they are to use each social network
Data and Limits
Audience Intelligence compliantly gathers data from publicly available sources, primarily through X (open data), and enriches its data with integrations such as IBM Watson for online habits, consumer mindsets, and personality, as well as through Meta and public censuses.
A standard subscription allows you to create one report each month (unless you purchase additional reports).


