
What Is CLS?
CLS (Cumulative Layout Shift) measures how much the layout shifts unexpectedly when users are viewing your webpage.
A layout shift, or content shift, is any time something on the page visibly changes position within the frame.
That could mean the text font changing, images loading slowly, and pop-ups shifting your page content.
Here’s an example:

Why Is CLS Important?
CLS is important because layout shifts harm the user experience. And CLS, alongside the other Core Web Vitals, is a ranking factor.
Imagine you’re reading an article and, suddenly, new elements like banner ads pop up, pushing down the content you’re trying to read.
Frustrating, right?
That’s part of why CLS is one of Google’s overall page experience signals. Alongside the other two Core Web Vitals: First Input Delay (FID) and Largest Contentful Paint (LCP).

Having multiple content shifts on a page will add up to a poor CLS score. An ideal page experience is a page with minimal CLS.
And poor performance for Core Web Vitals can affect your performance in Google rankings.
Defining Good or Poor CLS
Google officially defines CLS scores within the following ranges:
- “Good” CLS: Below 0.10
- “Needs Improvement” CLS: Between 0.10 and 0.25
- “Poor” CLS: Above 0.25

How to Check Google CLS
There are many ways to check your CLS. But using Google’s PageSpeed Insights tool is a good starting point.
This tool analyzes CLS for both the desktop and mobile versions of your webpages.
Enter your page URL in the tool and click “Analyze.”

Then the tool will report your CLS performance. Along with your performance for other Core Web Vitals metrics.

But this tool can only check one page at a time.
To check CLS for multiple pages throughout your site, use Semrush’s Site Audit tool.
Set up a project in the tool and run your first crawl.
Once the crawl is complete, navigate to “Core Web Vitals” and click “View details.”

This will open the Core Web Vitals performance report for your website.

Scroll down and you’ll see your CLS data. And recommendations for improvements.

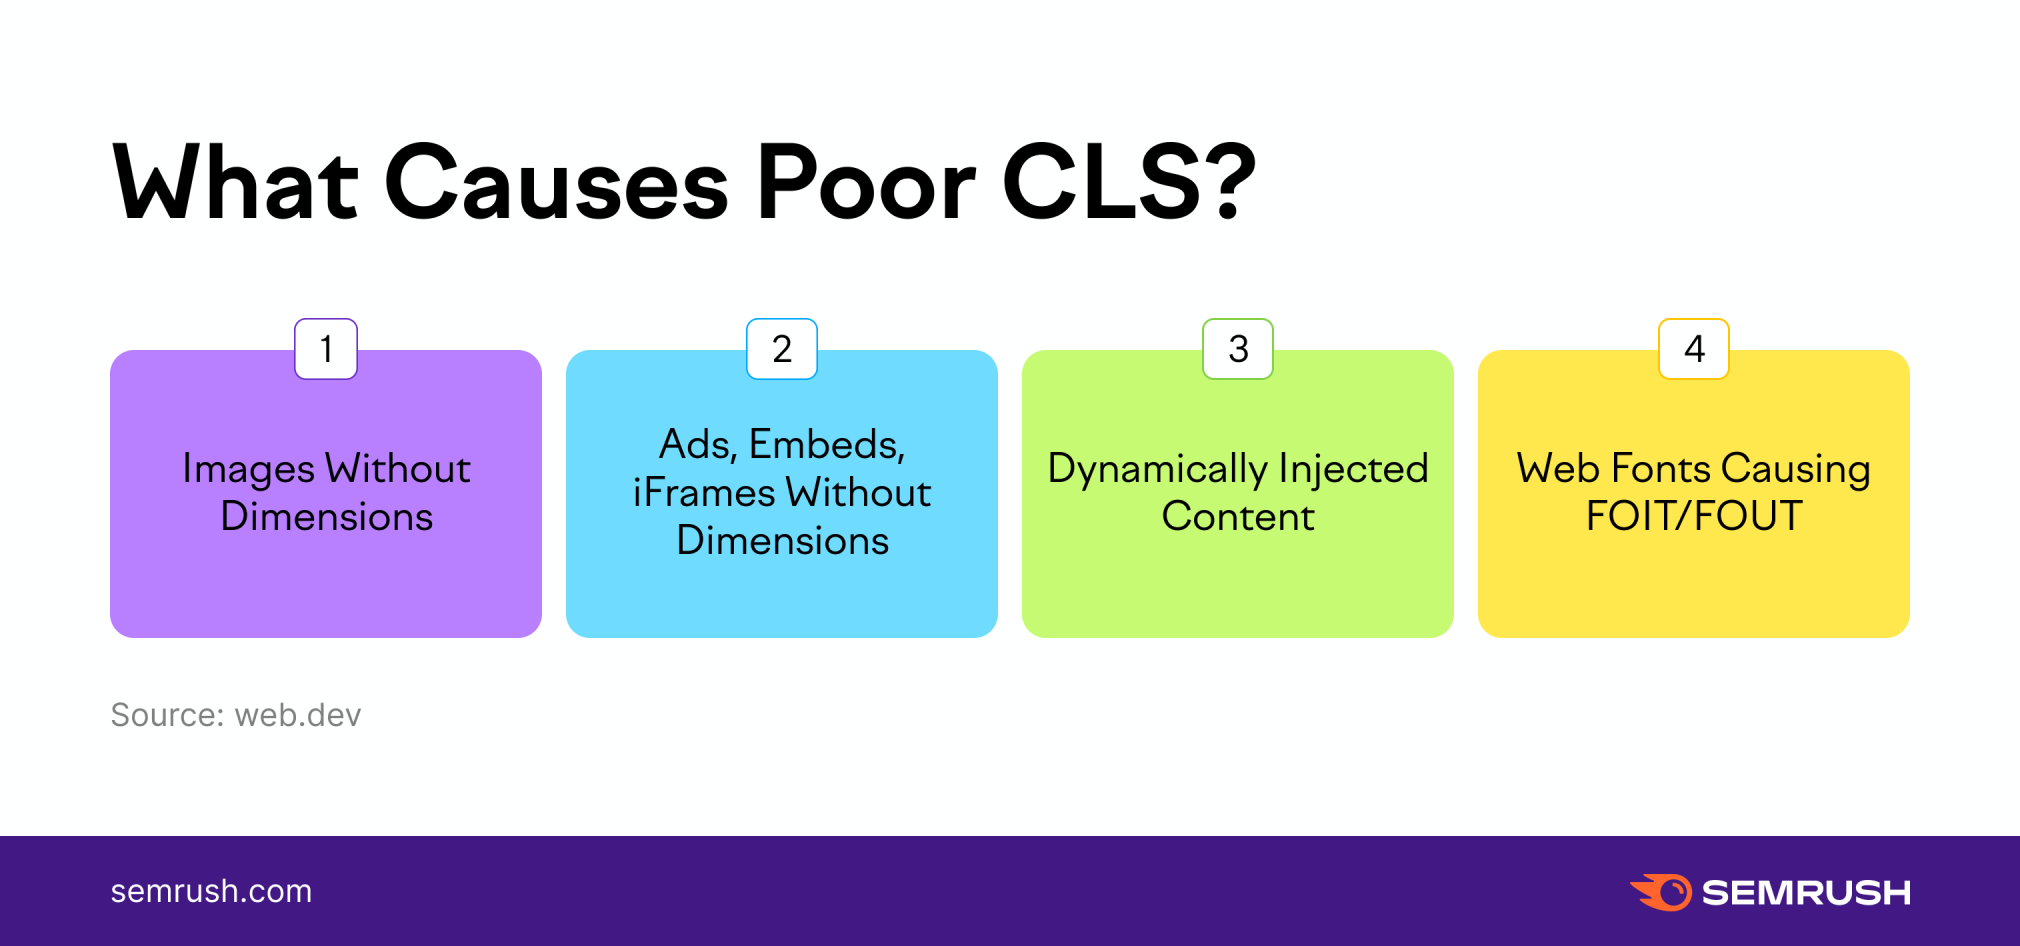
What Causes Poor CLS?
Multiple things can cause layout shifts. The most common culprits include the following:
- Images without dimensions
- Ads, embeds, and iframes without dimensions
- Dynamically injected content
- Web fonts causing FOIT/FOUT (flash of invisible text and flash of unstyled text)
All of these causes live in your page’s code. And it’s easy to identify them in only a few minutes of inspection.
How to Inspect Layout Shifts
To optimize for CLS, you first need to identify the exact elements causing layout shifts.
Chrome’s DevTools can help you with that.
In the Google Chrome internet browser, right-click anywhere on the page and select “Inspect.”

You’ll see the DevTools panel on the right side:

Now go to the “Lighthouse” tab and click “Analyze page load.”

This will generate a Lighthouse performance report for your website.

If there were layout shifts on the page, you’ll see that under the “DIAGNOSTICS” section of the report.

Now expand the item. You’ll see which elements were causing layout shifts. And their individual contribution to your CLS score.

Look for the larger CLS contributions. Don’t worry if you see an element with a CLS contribution of 0.001, for example. Because it won’t really hurt the user experience.
You have a real CLS problem only if all elements combined contribute to a Google CLS score of anything more than 0.10.
If you want to dig deeper and find out when those shifts happened in the timeline as the page was loading, you’ll need to view the original trace.
To do that, click “View Original Trace” in the Lighthouse report.

This will open the “Performance” tab.
Look through the “Experience” track or layout shifts (LS) notation in the “Web Vitals” track to find when the shifts happened.

How to Fix and Avoid Layout Shifts
Your developer can optimize your CLS in a number of ways.
Here are some tips to get you started:
- Avoid non-composited animations
- Ensure text remains visible during webfont load
- Fix image elements that don’t have explicit width and height

Monitor CLS with Semrush
Semrush’s Site Audit tool allows you to track your performance for Google CLS. Along with the other Core Web Vitals.
The tool will even save your historical data in the special Core Web Vitals report.
This allows you to inspect your Core Web Vitals, make changes, and then run the audit again to see how your scores improved.

You’ll also find a whole performance report with more information about how to improve the overall page load speed of your website, along with other optimization tips.