
As a website owner, tracking pageviews in Google Analytics 4 is probably high on your list of priorities.
You’ve put a lot of effort into building your website and optimizing it for a great user experience. And pageviews data allows you to measure the success of your efforts and find areas for improvement.
In this guide, we’ll show you where to find pageviews data and how to use it to improve your website’s performance.
What Is a Pageview in Google Analytics 4?
A pageview in Google Analytics 4 (GA4) is an event that triggers when a user views a page on your website.
Here’s an example of a pageview report in GA4:
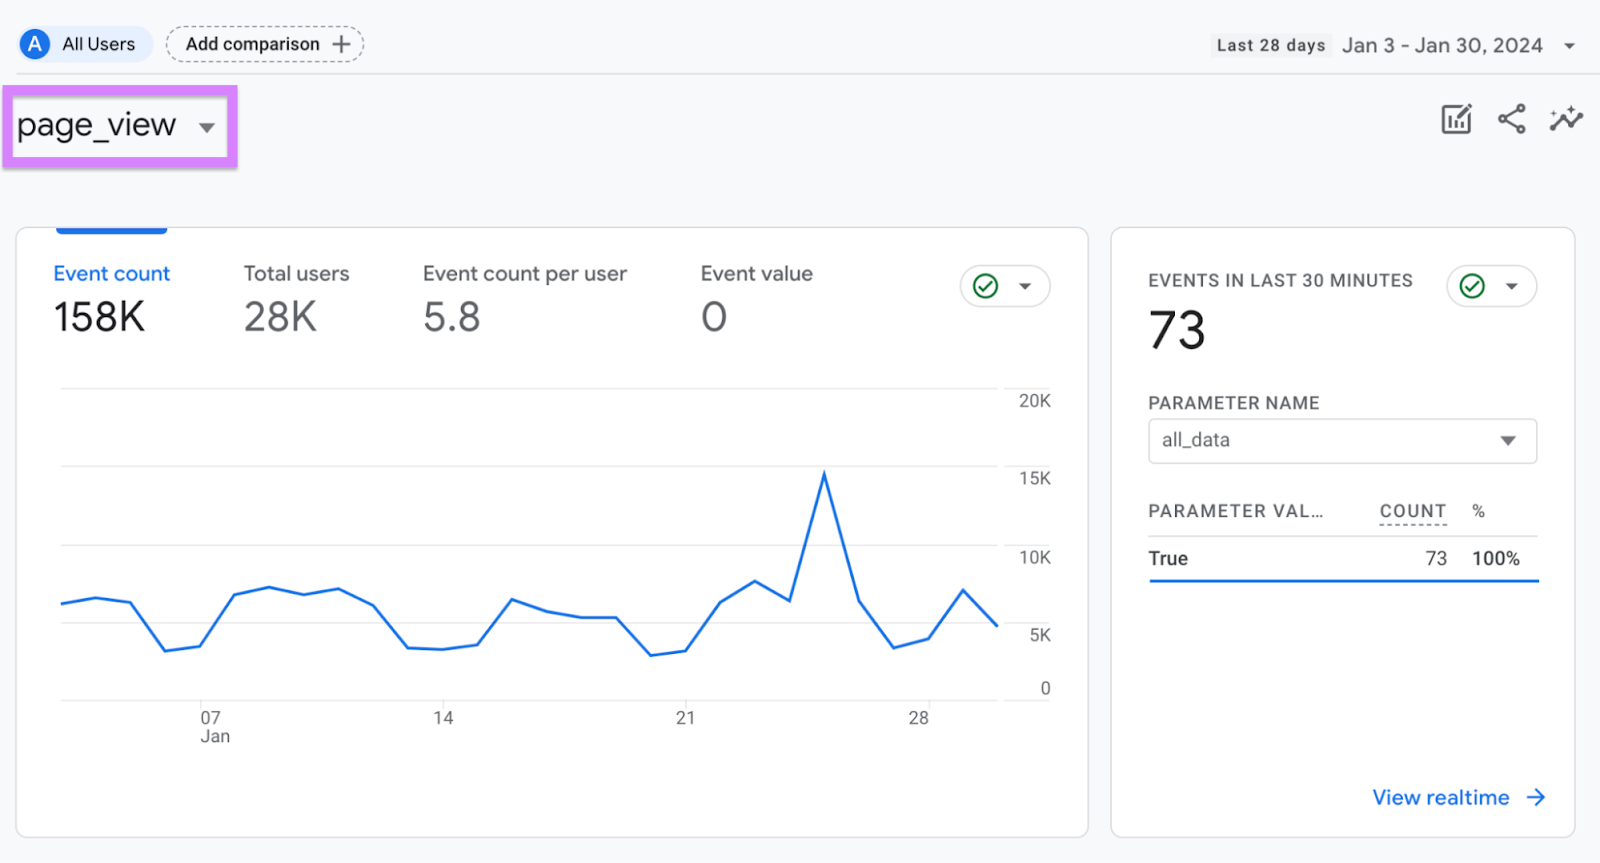
Technically, the event is spelled “page_view.” But for the sake of readability, we’ll also spell it without the underscore throughout this article.
The pageview event triggers each time the user’s browser loads or reloads a page. So, if a user sees the same page multiple times, GA4 will still count the repeated views.
GA4 automatically collects pageview data—you don’t need to set up anything manually in your account.
This event can help you understand which pages on your website get the most traffic. It also allows you to compare traffic numbers over time:
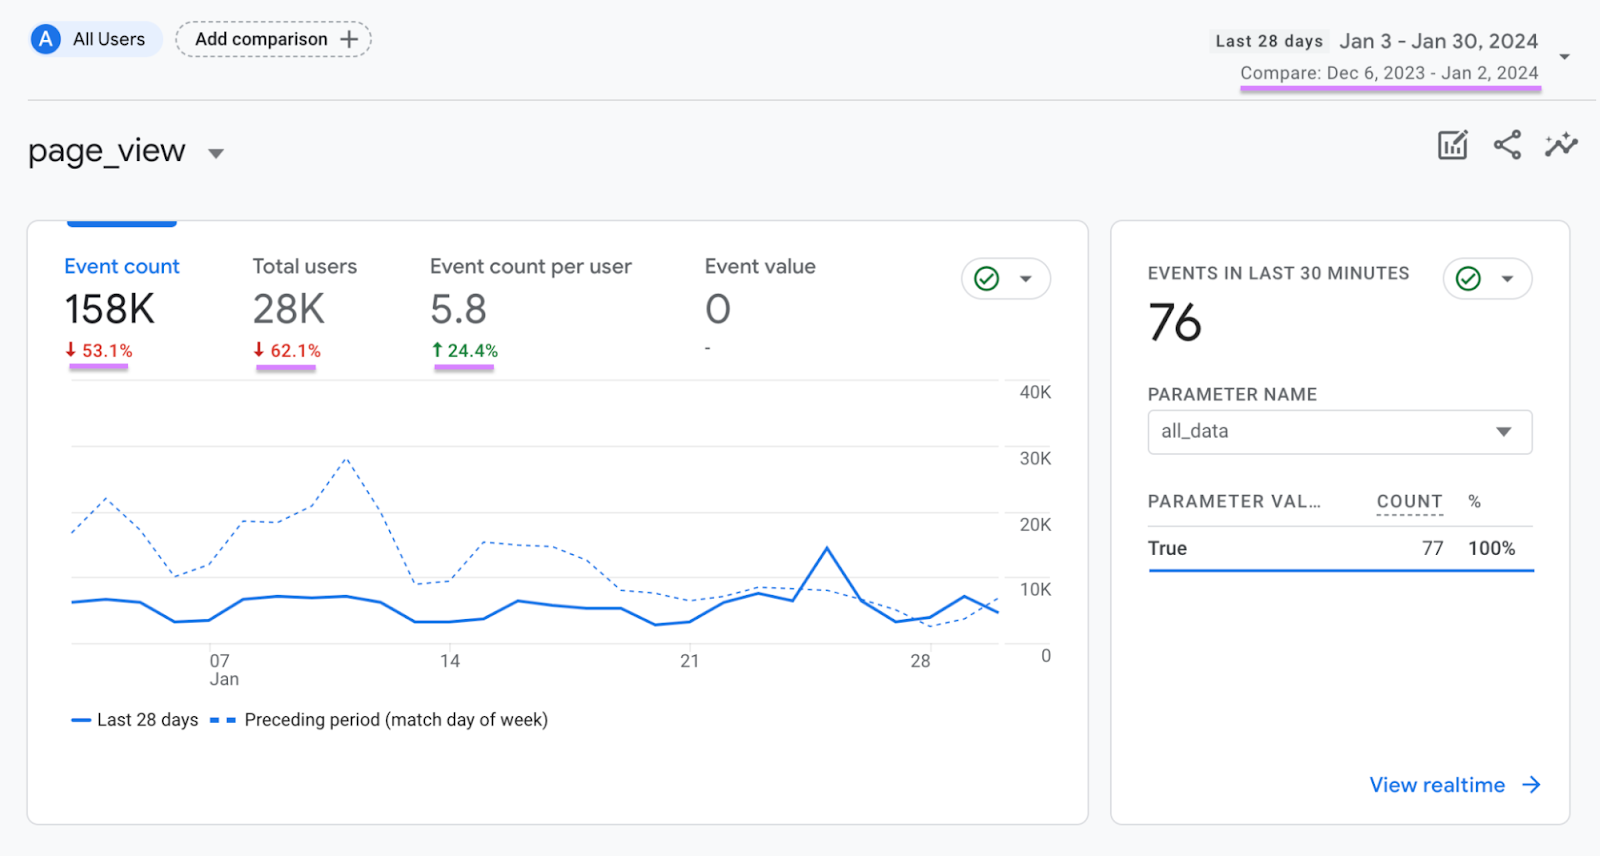
Comparing pageview data allows you to analyze the success of your SEO strategy, identify traffic trends, and make data-driven decisions.
But keep in mind that pageviews on their own don’t provide the whole picture. You need to factor in other metrics like conversions and engagement time for a more in-depth analysis.
You might get a high number of pageviews. But if those pageviews don’t lead to engagement with your content or conversions (like sales or email signups), it could be a sign of deeper problems with your content or website.
Further reading: Conversion Rate Optimization: 9 Tactics That Work
GA4 Pageview Event Parameters Explained
Whenever your website receives a pageview, Google Analytics also collects additional pieces of information about this interaction. These are known as event parameters.
They offer “valuable context and details about the interaction,” according to Google.
GA4 collects these page_view event parameters:
- page_location (the URL of the page)
- page_referrer (the URL of the page the user was previously on)
These parameters are important because they provide extra information about the visitor’s experience on your site.
Before we go into detail on finding pageviews data in GA4, we need to understand a few other metrics.
GA4 Views vs. Sessions vs. Users
Views, sessions, and users all correspond to different metrics within Google Analytics 4:
- Views: The sum of pages and screens that your users saw (a screenview is the same as a pageview—just for apps, rather than webpages). It includes repeated views of one page or screen.
- Sessions: The period of time during which a user interacts with your website (or app). It starts from the moment a visitor opens your website and ends after 30 minutes of inactivity.
- Users: An individual who visited your website or app. In GA4, the primary user metric is “Active users.” These are users who had an engaged session. An engaged session lasts at least 10 seconds or includes at least one conversion event, or at least two screen/pageviews.
Further reading: 12 Key Google Analytics Metrics to Track
Universal Analytics Pageviews vs. GA4 Views
There are many differences between Universal Analytics (UA) and Google Analytics 4. But the pageview metric has largely remained the same.
In UA, “Pageviews” referred to the total number of pages a visitor viewed on your website. This included repeated views.
In GA4, “Views” refers to how many pages and/or app screens a user sees on your website or app. It also counts repeated views.
Previously, UA measured app data (like screenviews) in a different property. GA4 merges website and app data in the same property. So, if you are tracking your website and app in GA4, remember that the views metric contains data from both.
Are There Unique Pageviews in GA4?
Unlike UA, GA4 does not have “Unique Pageviews” as a metric.
Instead, the pages and screens report contains “Views," “Users,” and “Views per user,” alongside other metrics.
Some marketers rely on the “Users” metric as an alternative to unique pageviews. This is the total number of unique active users that viewed a given page.
How to See Pageviews in Google Analytics 4
There are a few different ways to see pageviews in different GA4 reports. We cover the two main methods below:
1. Pages and Screens Report
The pages and screens report displays data on the pages users visited on your website. If you’re also tracking an app in GA4, this report will include data on the specific screens users viewed, too.
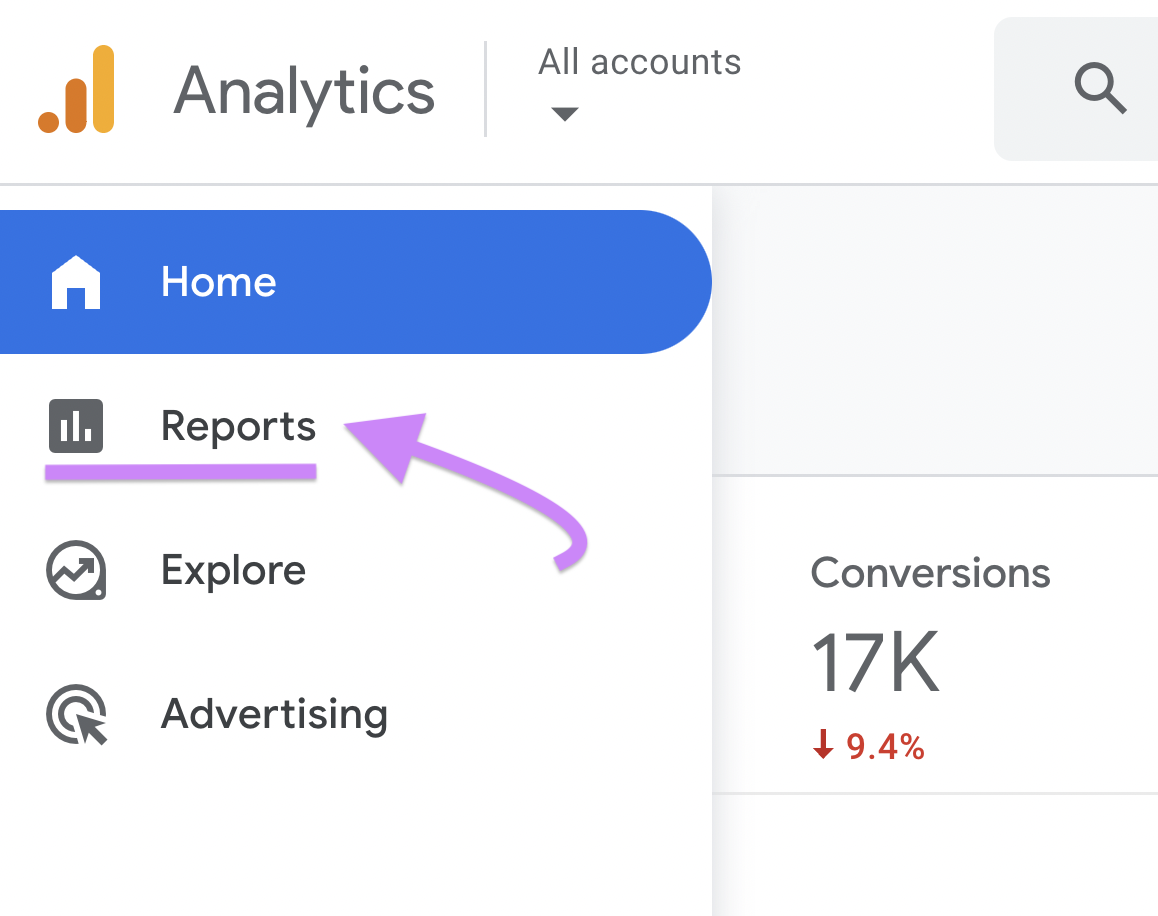
To find the pages and screens report, find the sidebar in the GA4 dashboard and click “Reports.”

Click “Life cycle” > “Engagement” > “Pages and screens.”
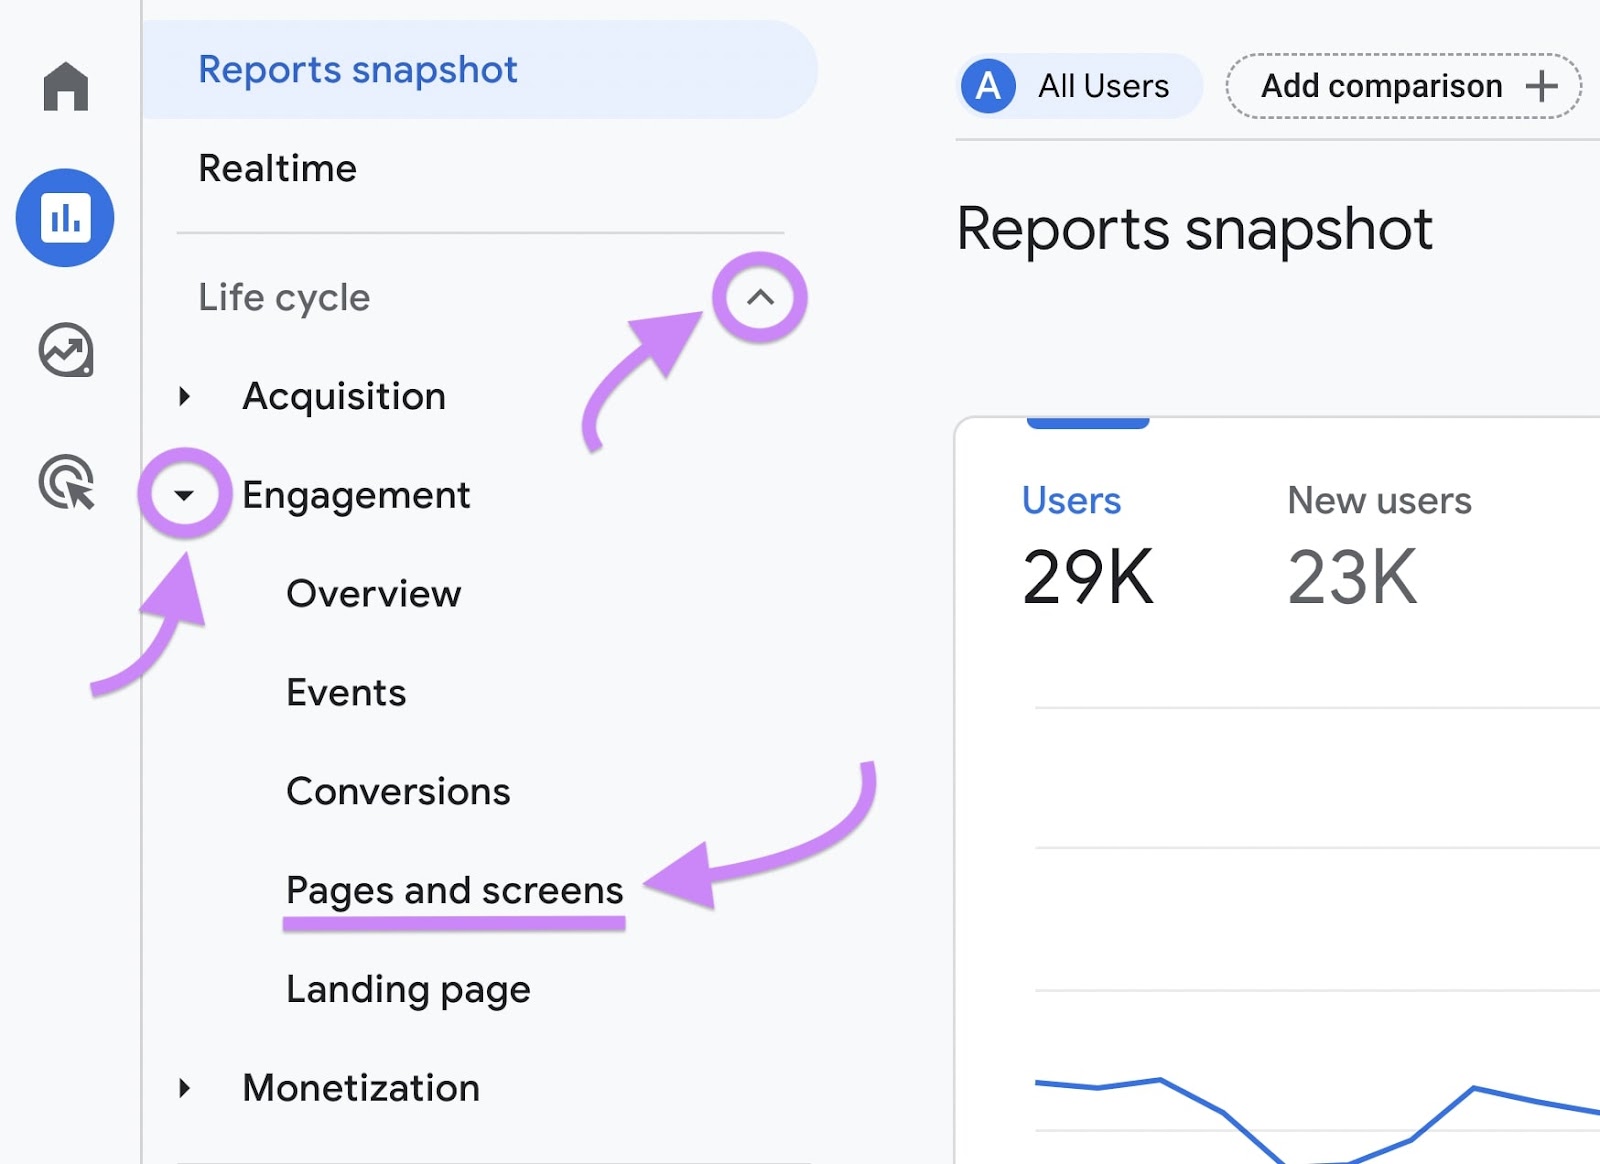
This will take you to the pages and screens report.
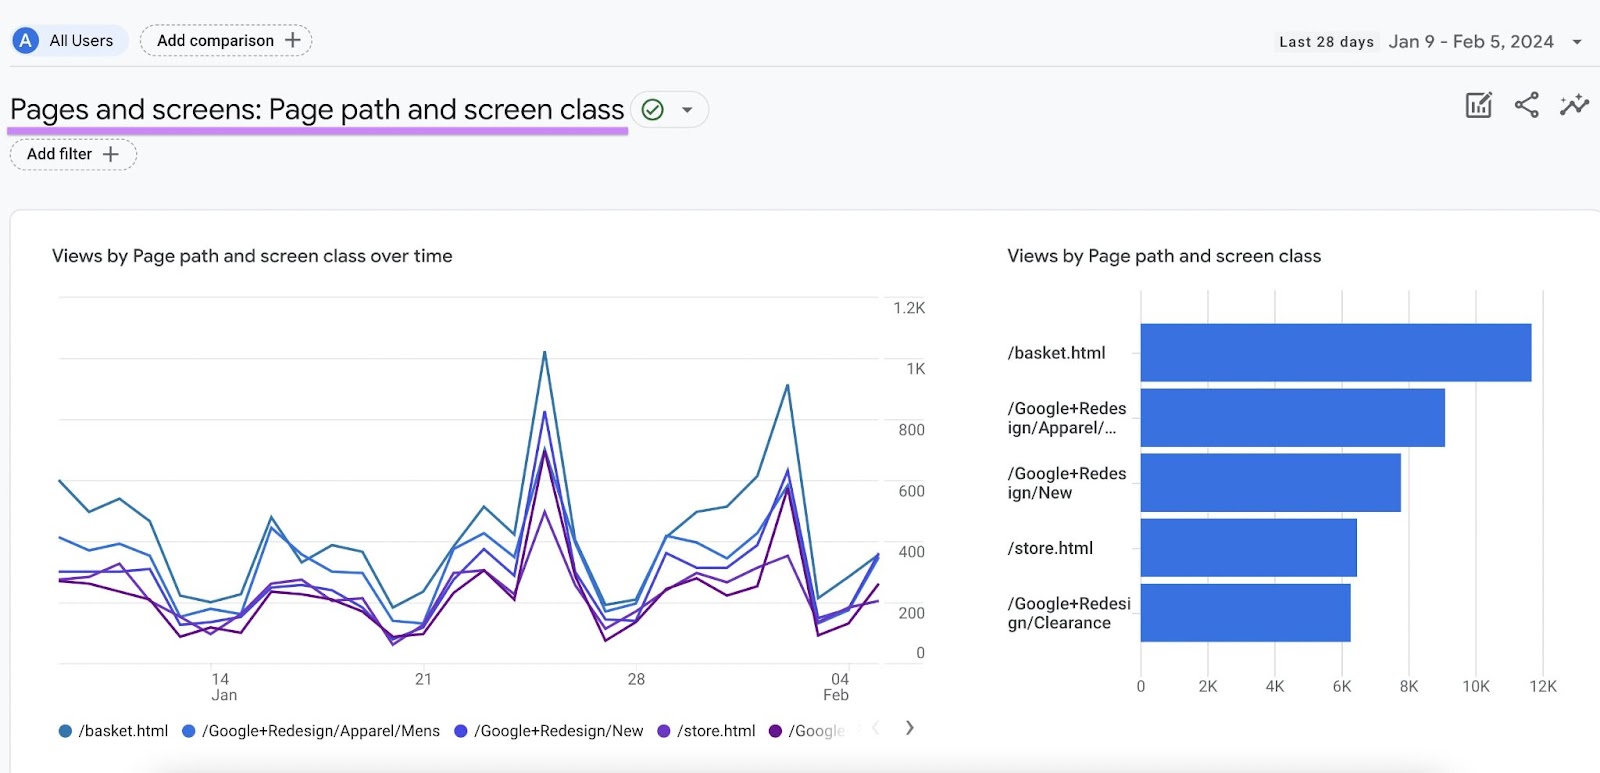
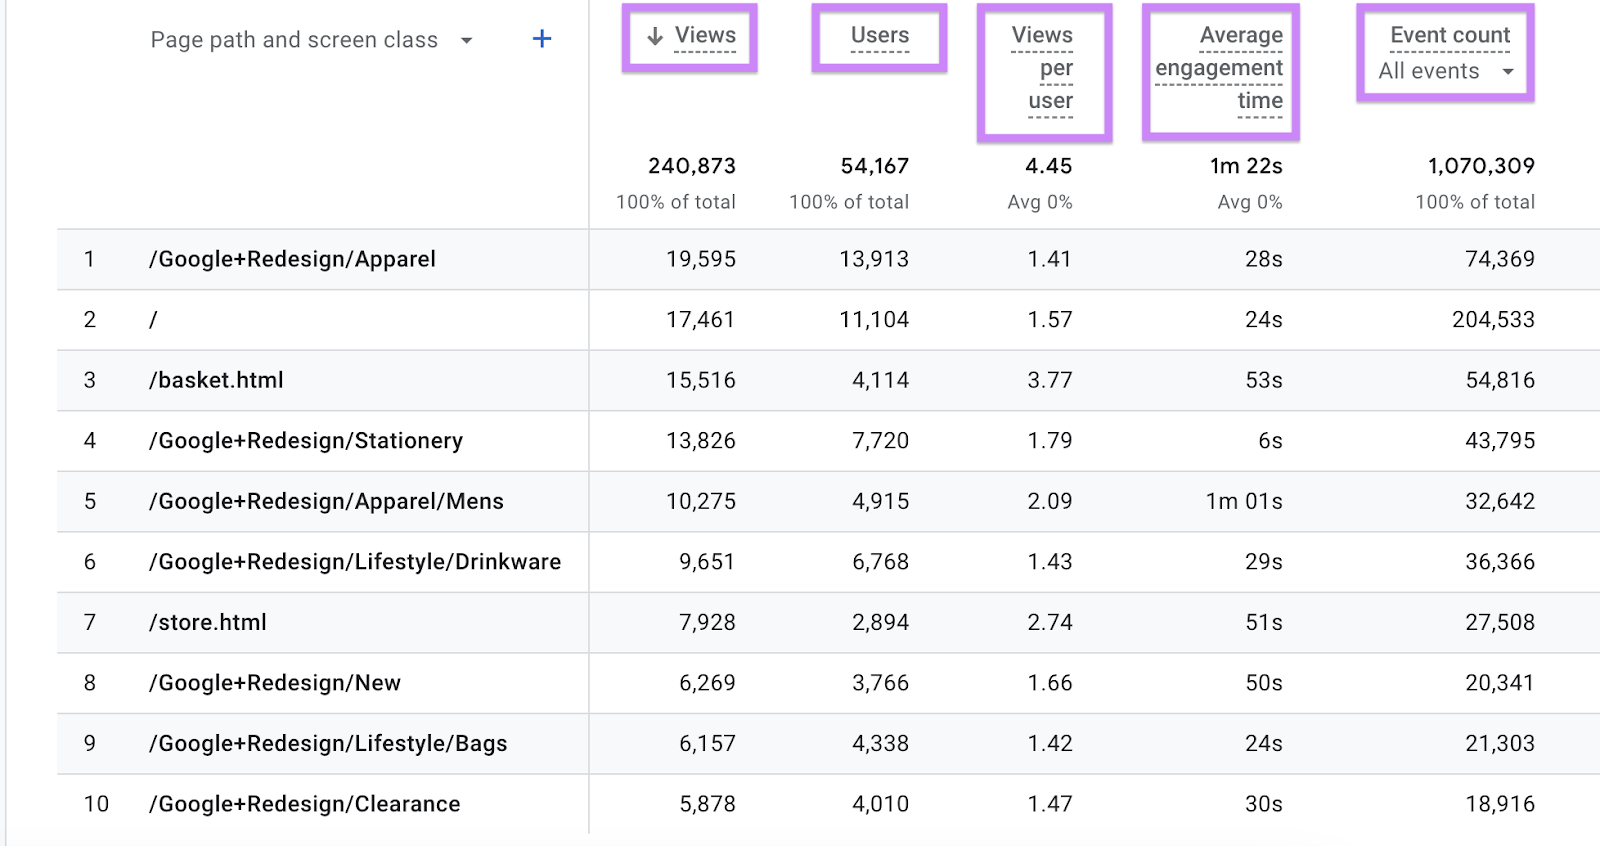
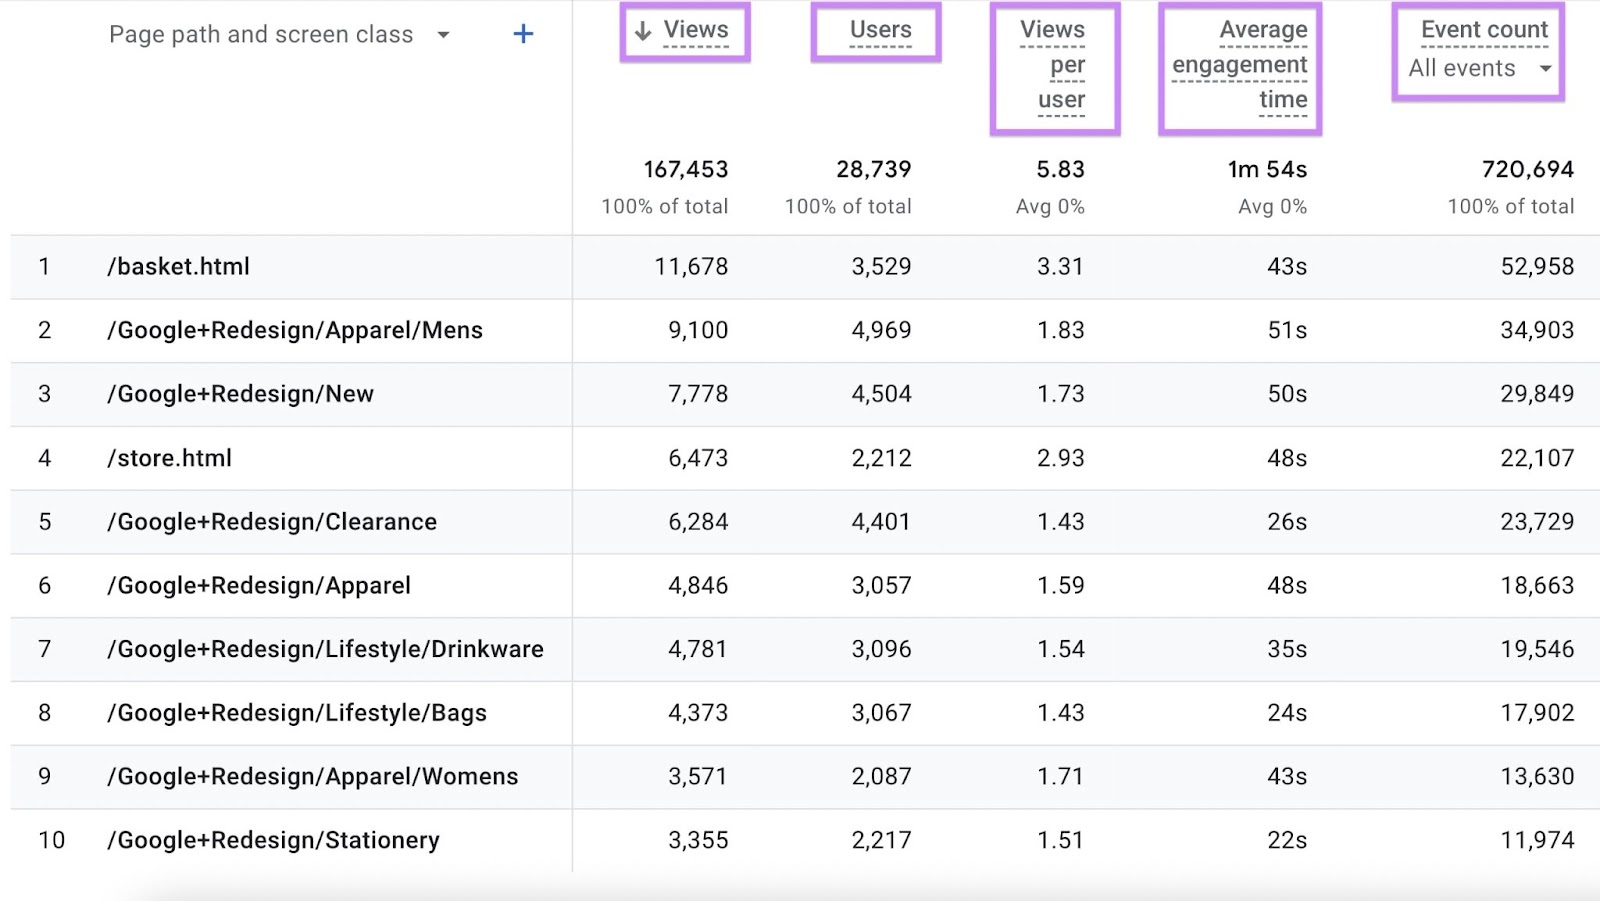
The table below the graph includes data on “Views,” “Users,” “Views per user,” and other metrics. (Remember that the “Views” metric includes pageviews and screenviews.)
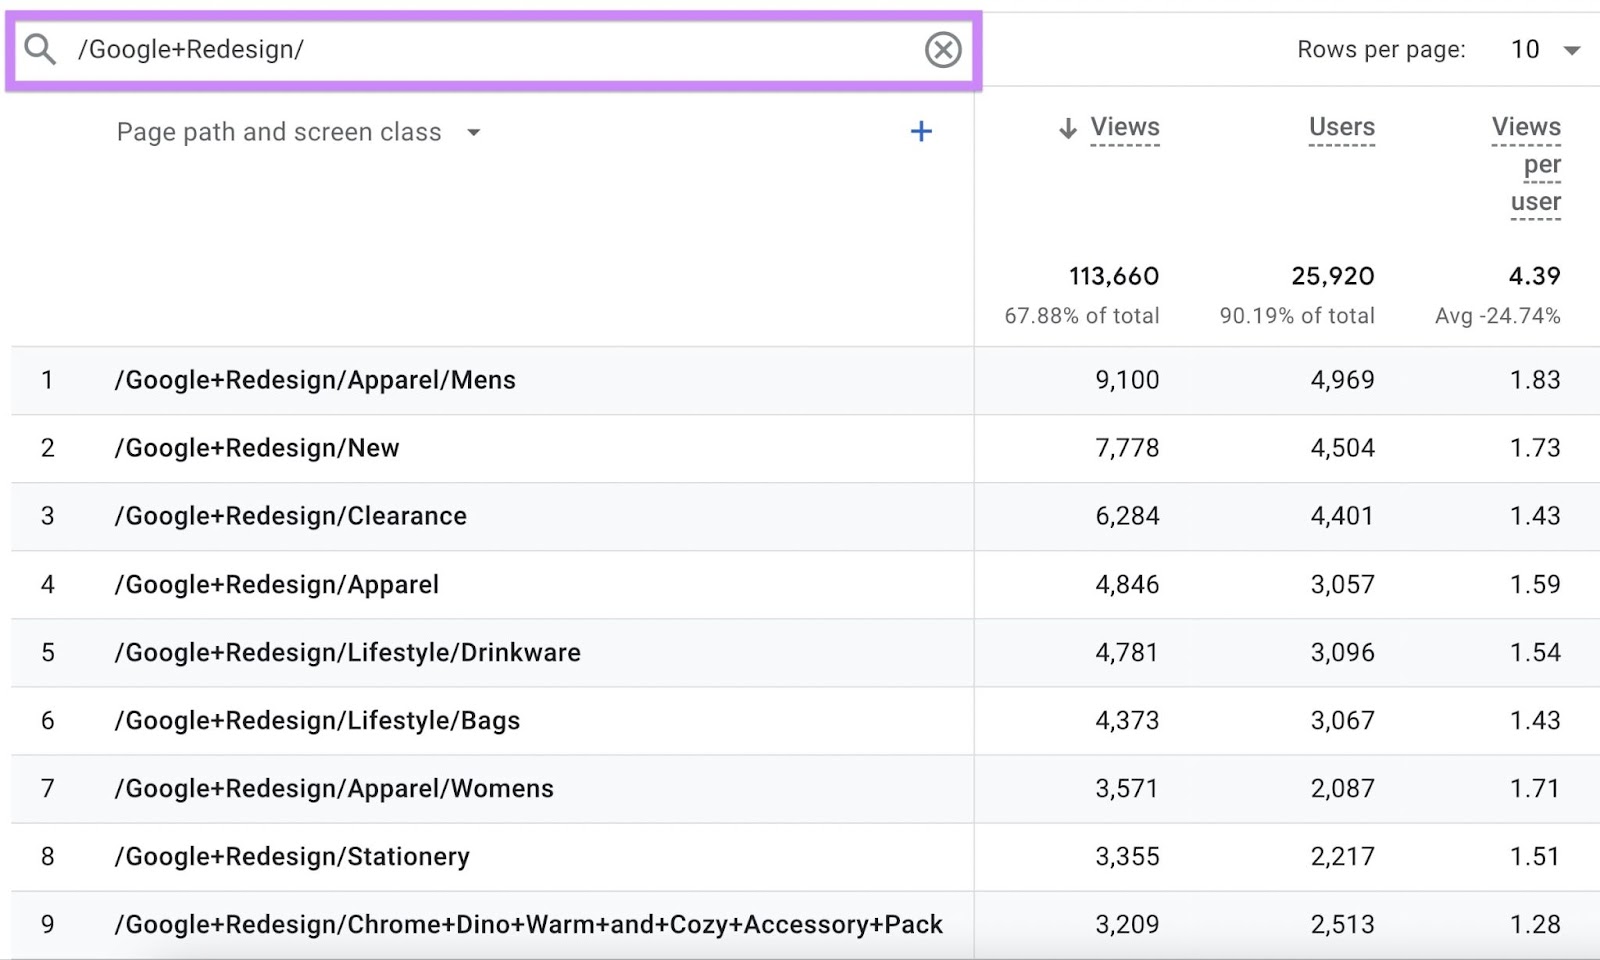
You can filter the table report using the search bar. You can search for individual words or specific URL paths.
Type in the keyword or path you’d like to analyze and hit enter. Now, you’ll only see data related to this page or group of pages.
2. Events Report
The events report contains data on all the events users triggered on your website. This is where you can find the total number of views across all of your site’s pages.
To find the events report, open the left-hand menu in your GA4 dashboard. Click on “Reports.”
Then, click “Life cycle” > “Engagement” > “Events.”
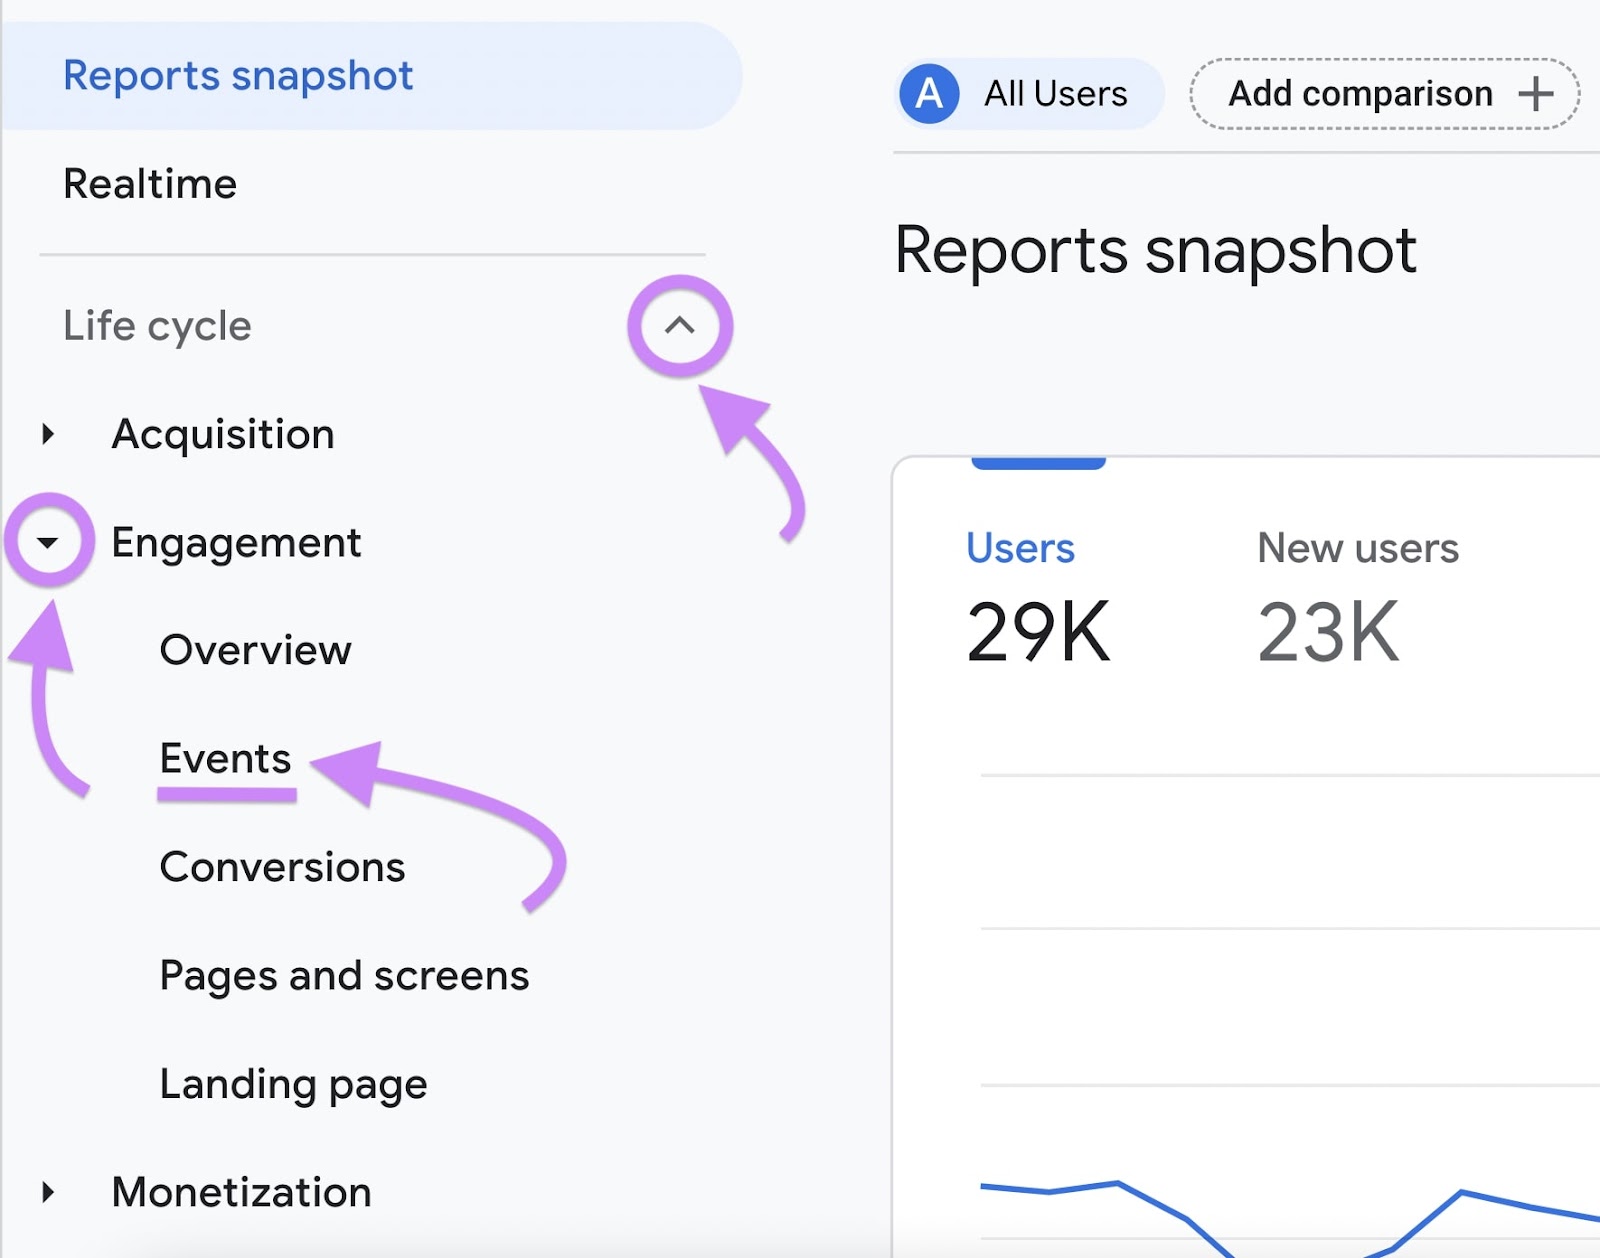
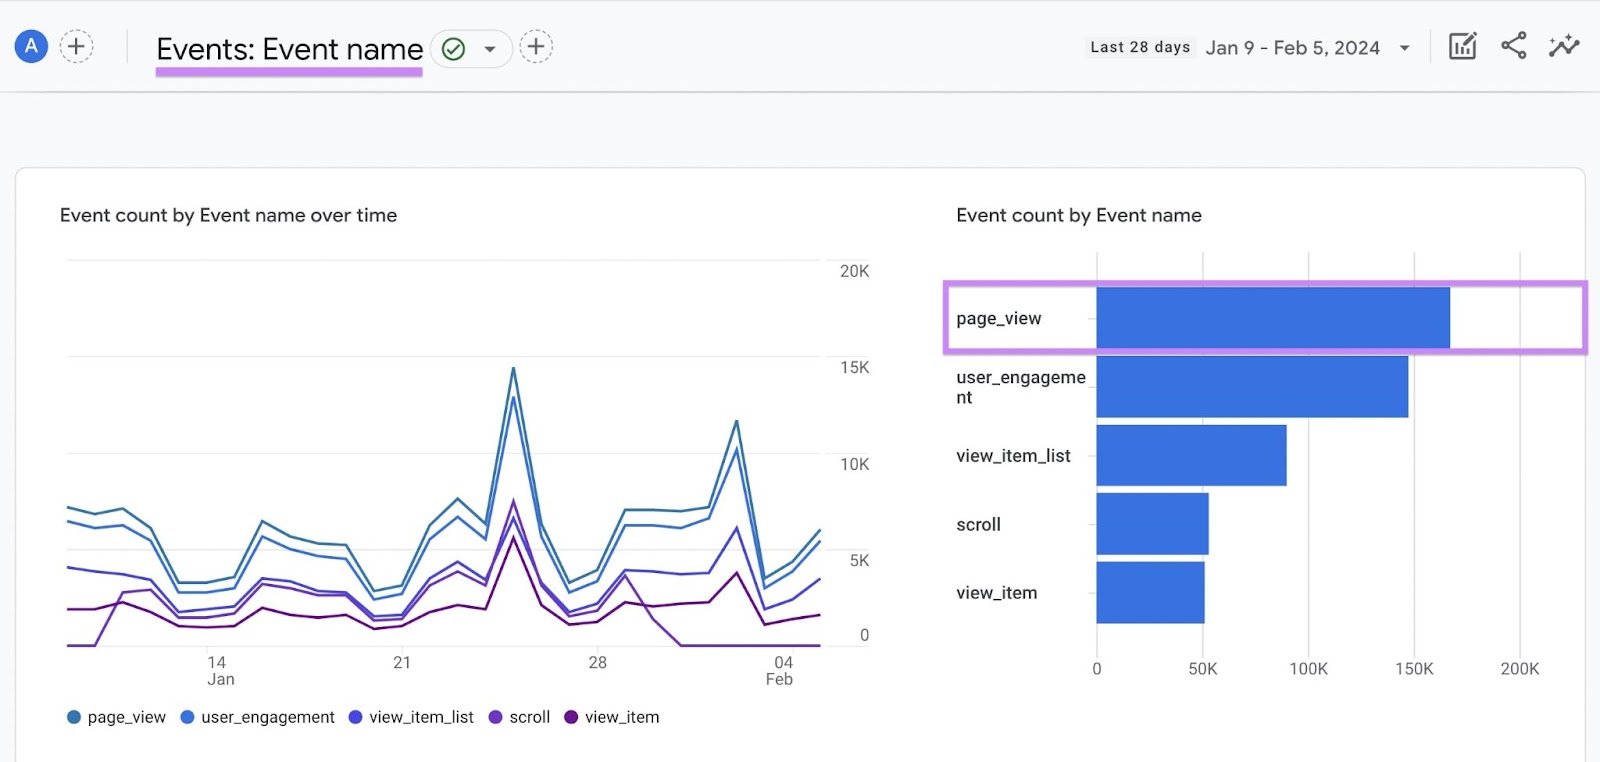
This will take you to the events report. In addition to the “page_view” event, you’ll see data regarding “user_engagement” and other events related to your property.
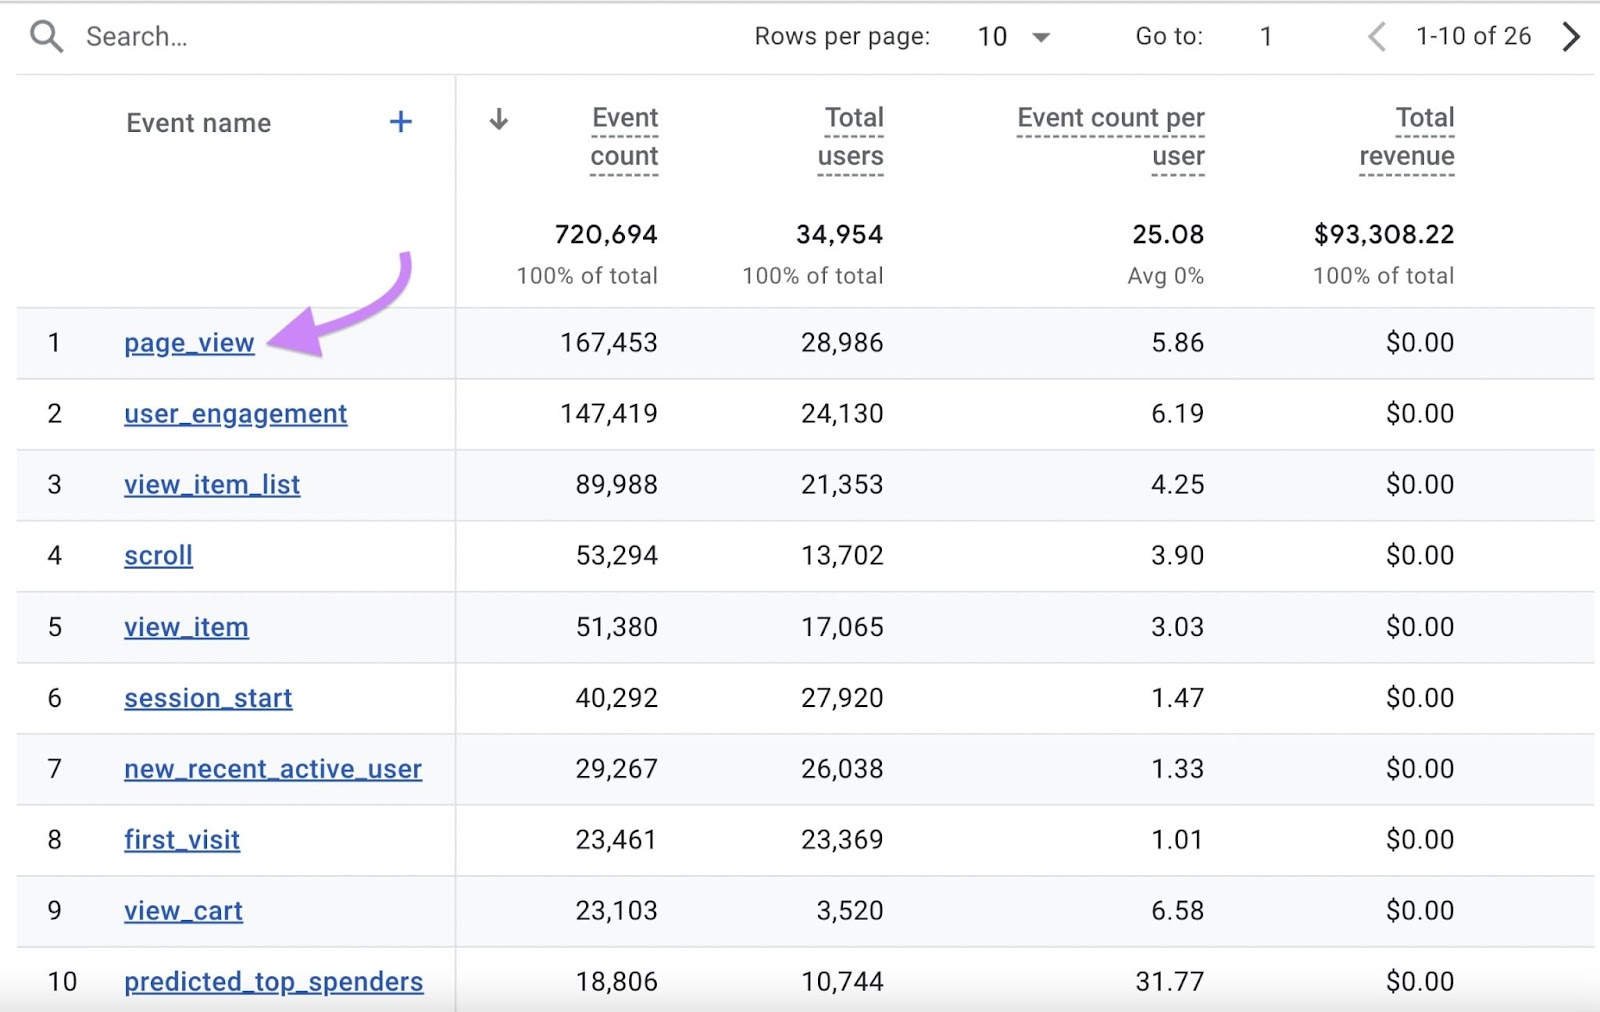
Scroll down to see a table overview of your event data. Click on “page_view” to go to another report containing only pageview data.
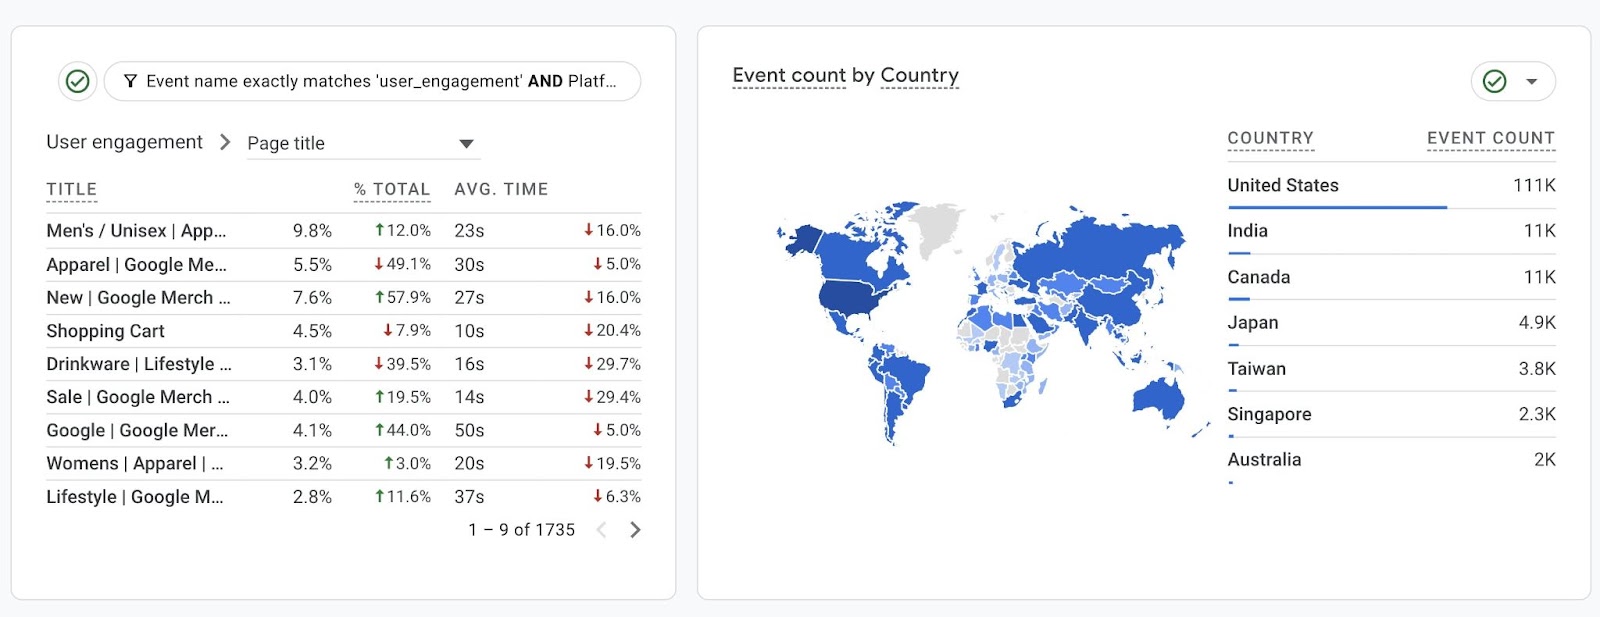
In the page_view report, you can learn how many views your website received in a set period. If you want the graph to display users instead, click on “Total users” at the top of the graph.
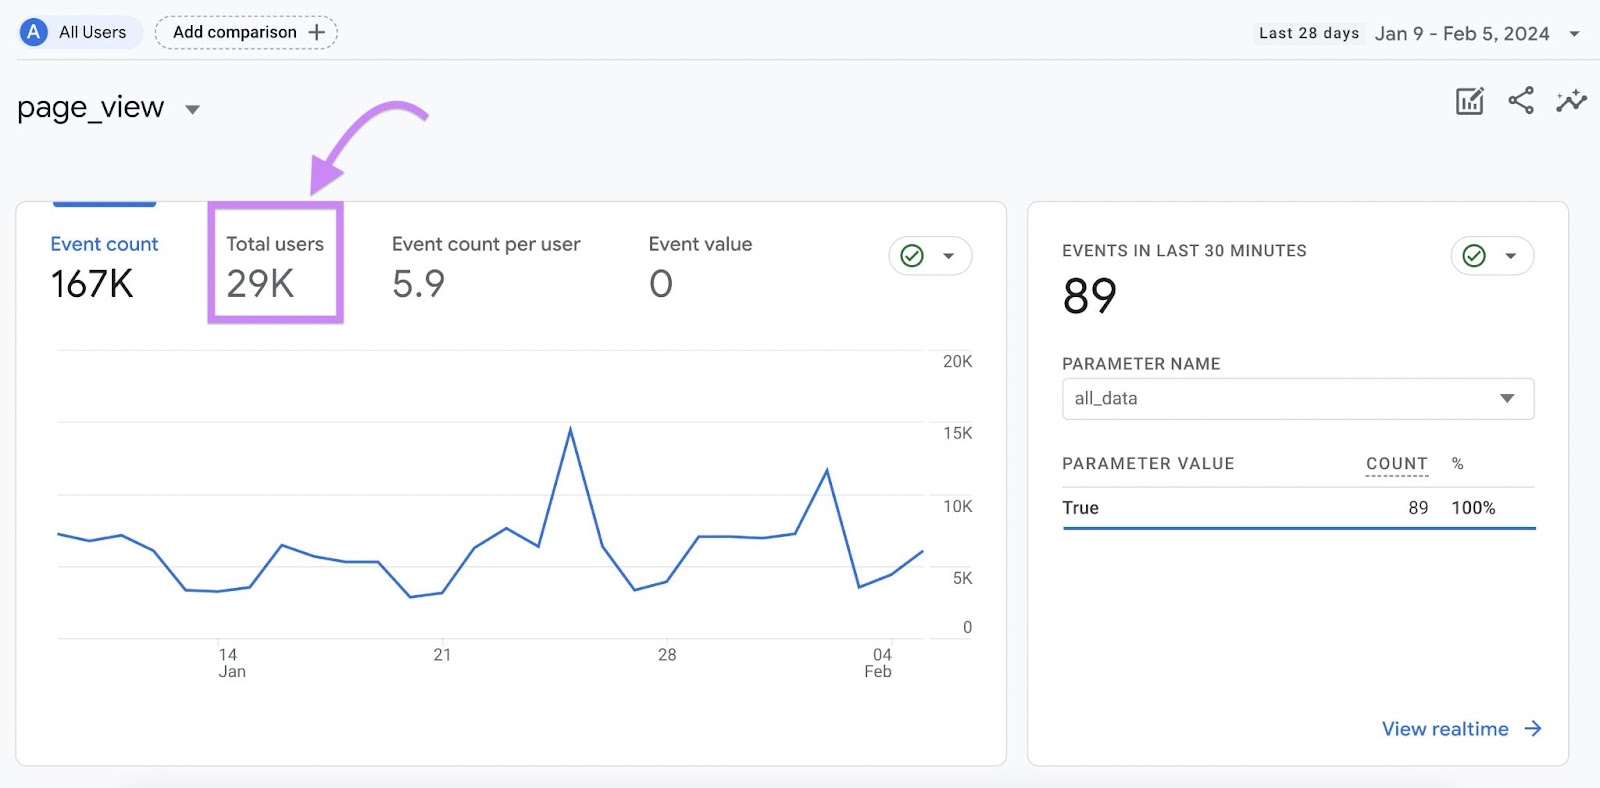
Scroll down to see additional data, such as the geographical distribution of your pageviews.
How to Use GA4 Views Data to Audit and Grow Your Website Traffic
Now that you know where to find pageviews in GA4, it’s time to use this data to analyze and boost your traffic numbers. Here are a couple of ways to do that:
Identify Your Most Popular Pages
Measuring Google Analytics pageviews can help you identify your top-performing pages. And this lets you know what kind of content attracts the most visitors to your website.
You can then follow a similar blueprint when creating or updating other pages on your site.
A page with lots of views could still have a low conversion rate. And this is a potential sign of poor user experience.
Since views data contains traffic from all channels, it’s not suitable for all types of analysis.
If you want to analyze the success of your SEO strategy, for example, you’ll need to look at organic traffic specifically.
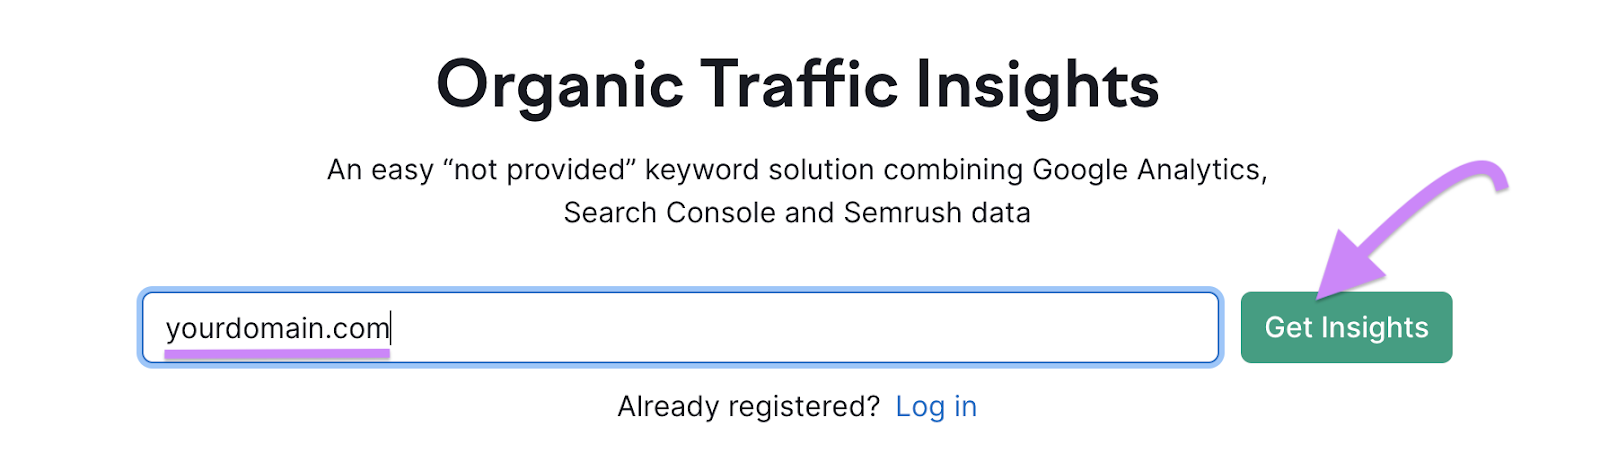
You can find and analyze your organic traffic data with ease using a tool like Semrush’s Organic Traffic Insights.
To start, enter your domain in the search bar. Then click “Get Insights.”
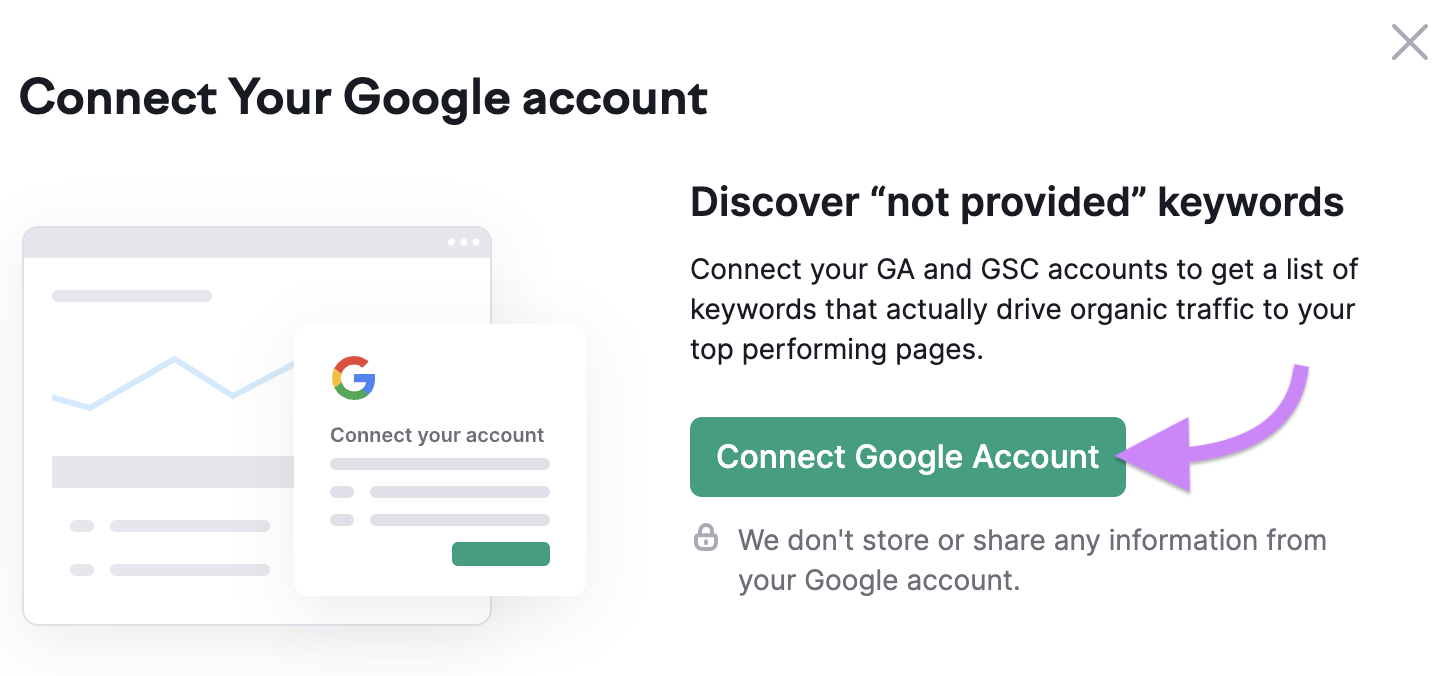
Then, connect your Google Analytics and Google Search Console accounts to Semrush. This step is important to combine all your organic traffic data into one place. And to discover all the keywords that are leading searchers to your site.
Do this by clicking “Connect Google Account” and following the setup instructions.
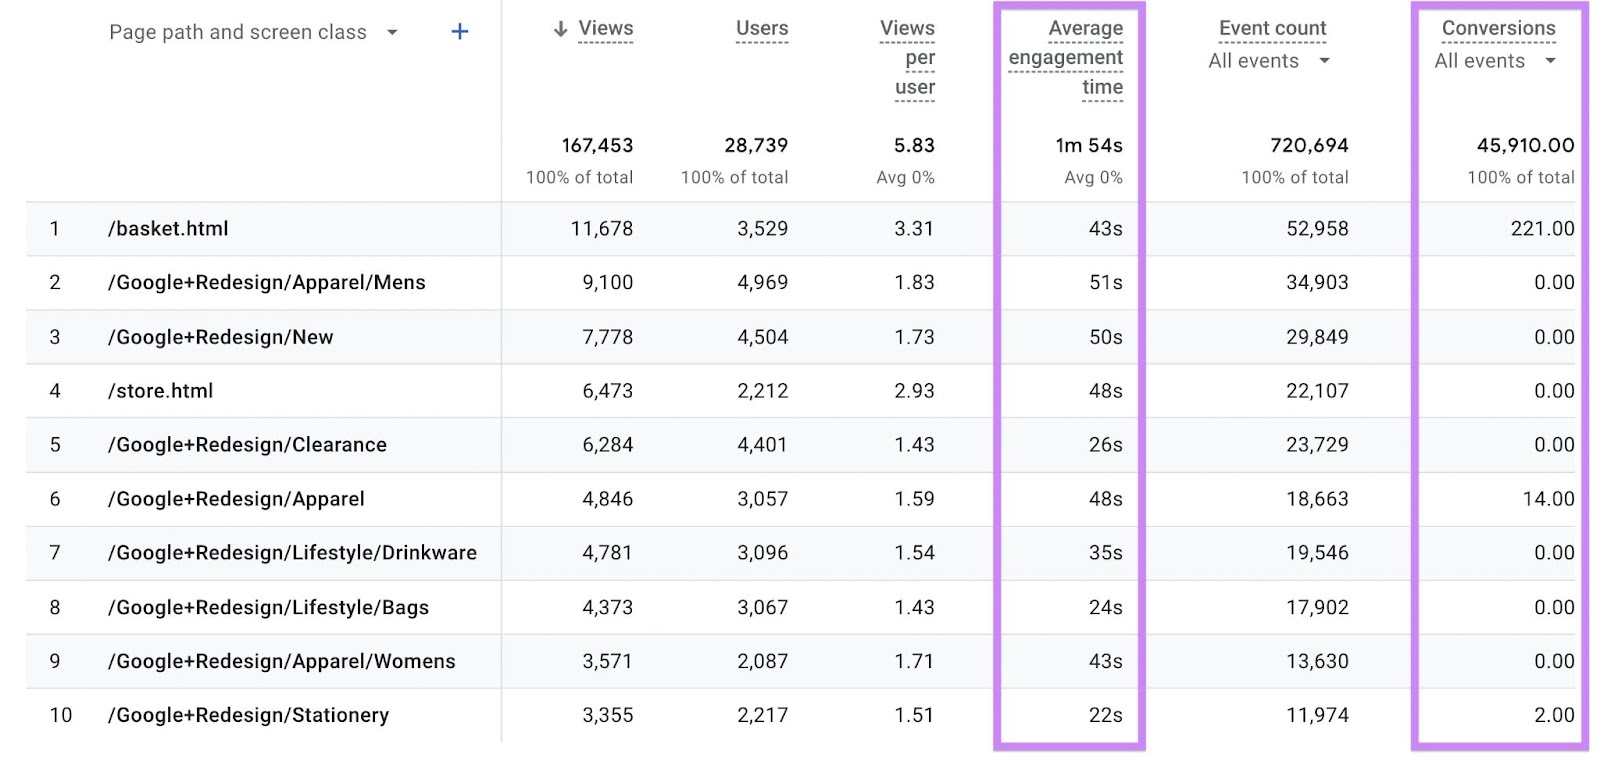
After completing the setup process, look to the “Sessions” column to find important organic traffic data, including “Engaged Sessions” and “Average Engagement time.”
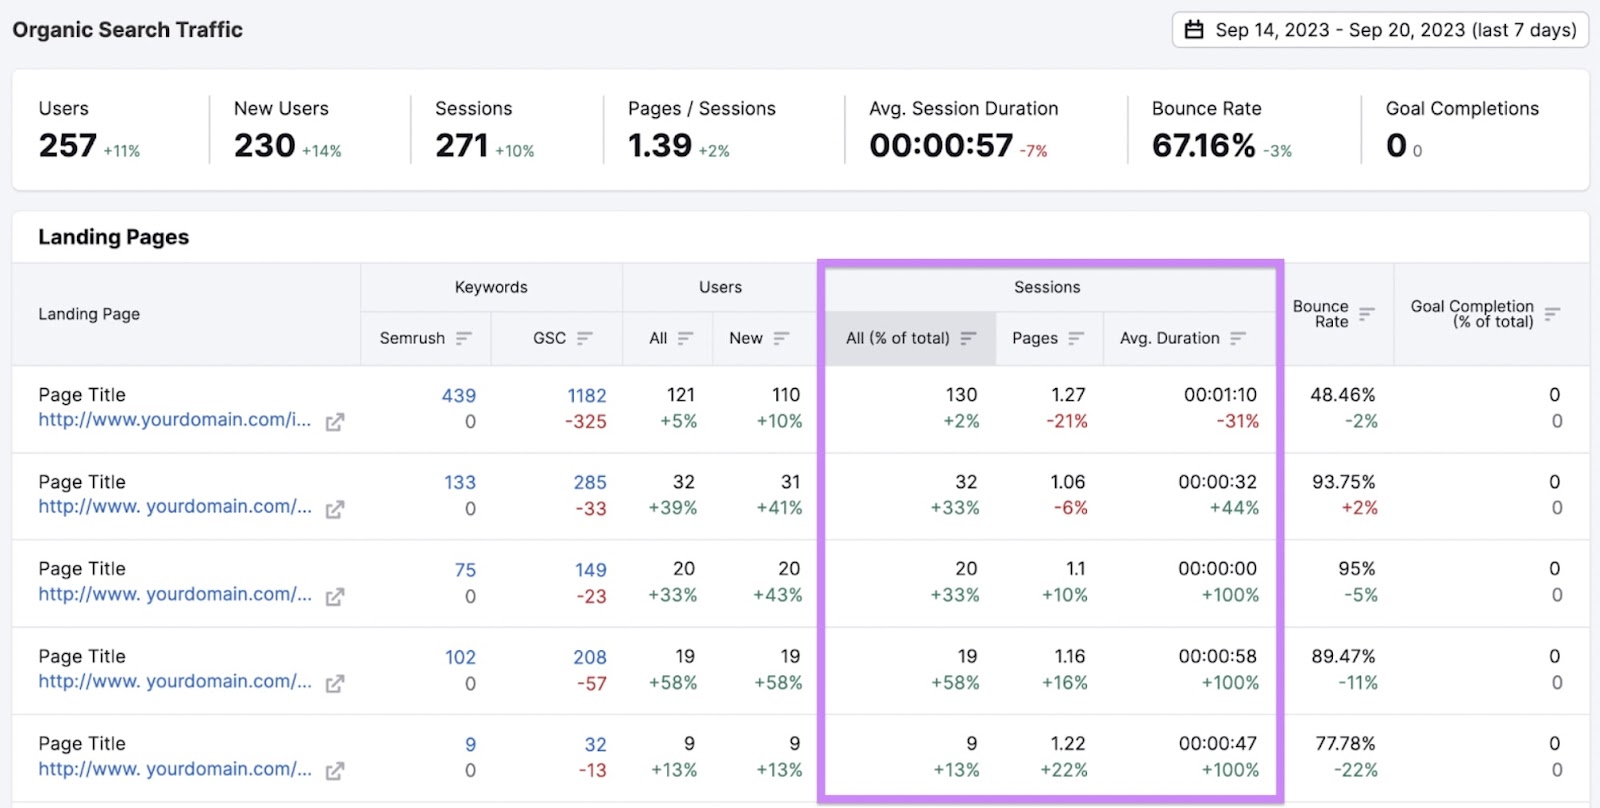
Using both pageview data and Organic Traffic Insights to analyze your website will give you a granular overview of page performance. And it helps shine a light on potential issues.
For example, a page with lots of sessions but a low average engagement time could mean the page doesn’t capture user attention.
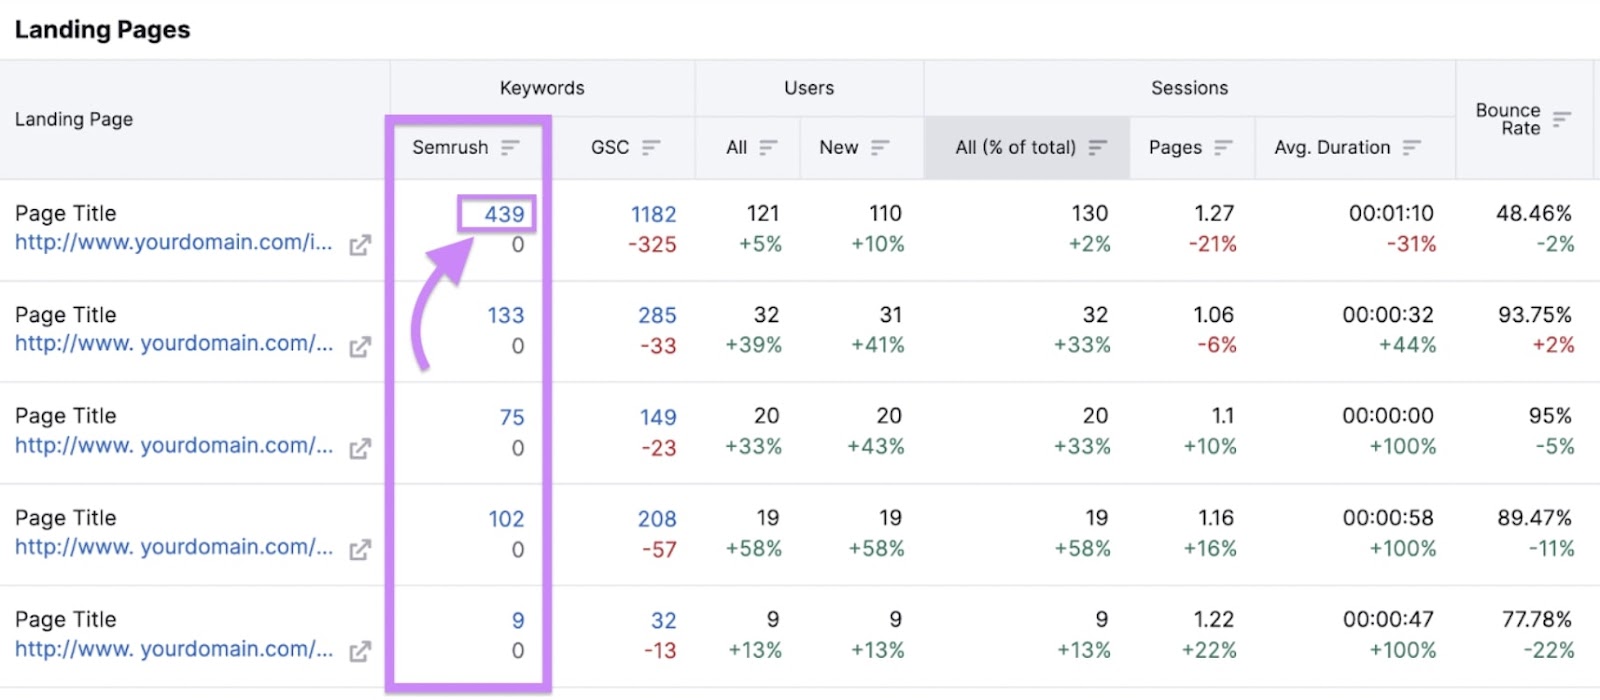
You can also analyze keyword data within the tool. This will help you understand which search queries are responsible for sending organic traffic to your most popular pages.
Since Organic Traffic Insights brings all of your keyword data into one place, you can explore both Semrush and Google Search Console data from one dashboard.
Click on the number of keywords in the left-hand column to go to the Semrush report.
You’ll see a list of the top keywords your page ranks for and its position in search. It also lists the traffic share for each keyword, indicating the proportion of that page's traffic that comes from specific keywords.
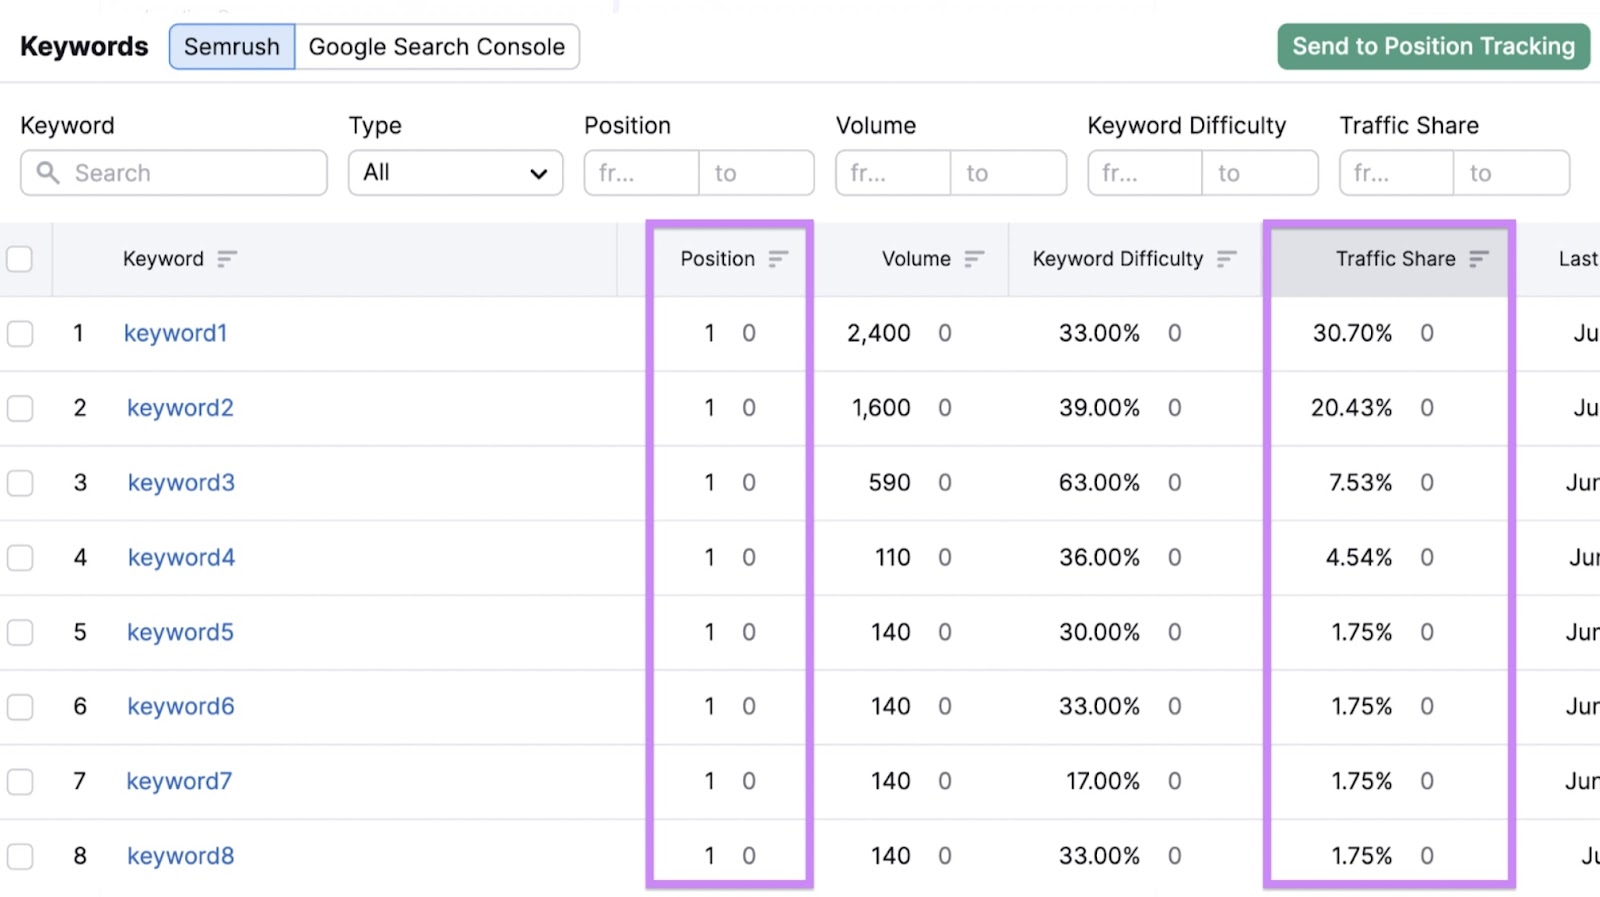
This data can provide a simple way to understand which keywords are driving pageviews for your content. You can use these insights to further optimize each page for your target keywords, while tracking them over time within the tool.
Find Pages That Are Losing Views
Tracking pageviews in GA4 also allows you to easily see which pages are losing traffic over time. This is useful because you can quickly identify which pages you might want to update.
Head to the pages and screens report that we outlined in the previous section.
In the top right corner, you’ll find a date range. Here, it’s set to show data from the past 28 days.

Click on the date to pull up a window where you can customize the dates. Click the toggle next to “Compare.” This will automatically set the comparison date to the preceding 28 days.
Feel free to customize this range to fit your analysis. When you’re done, click “Apply.”
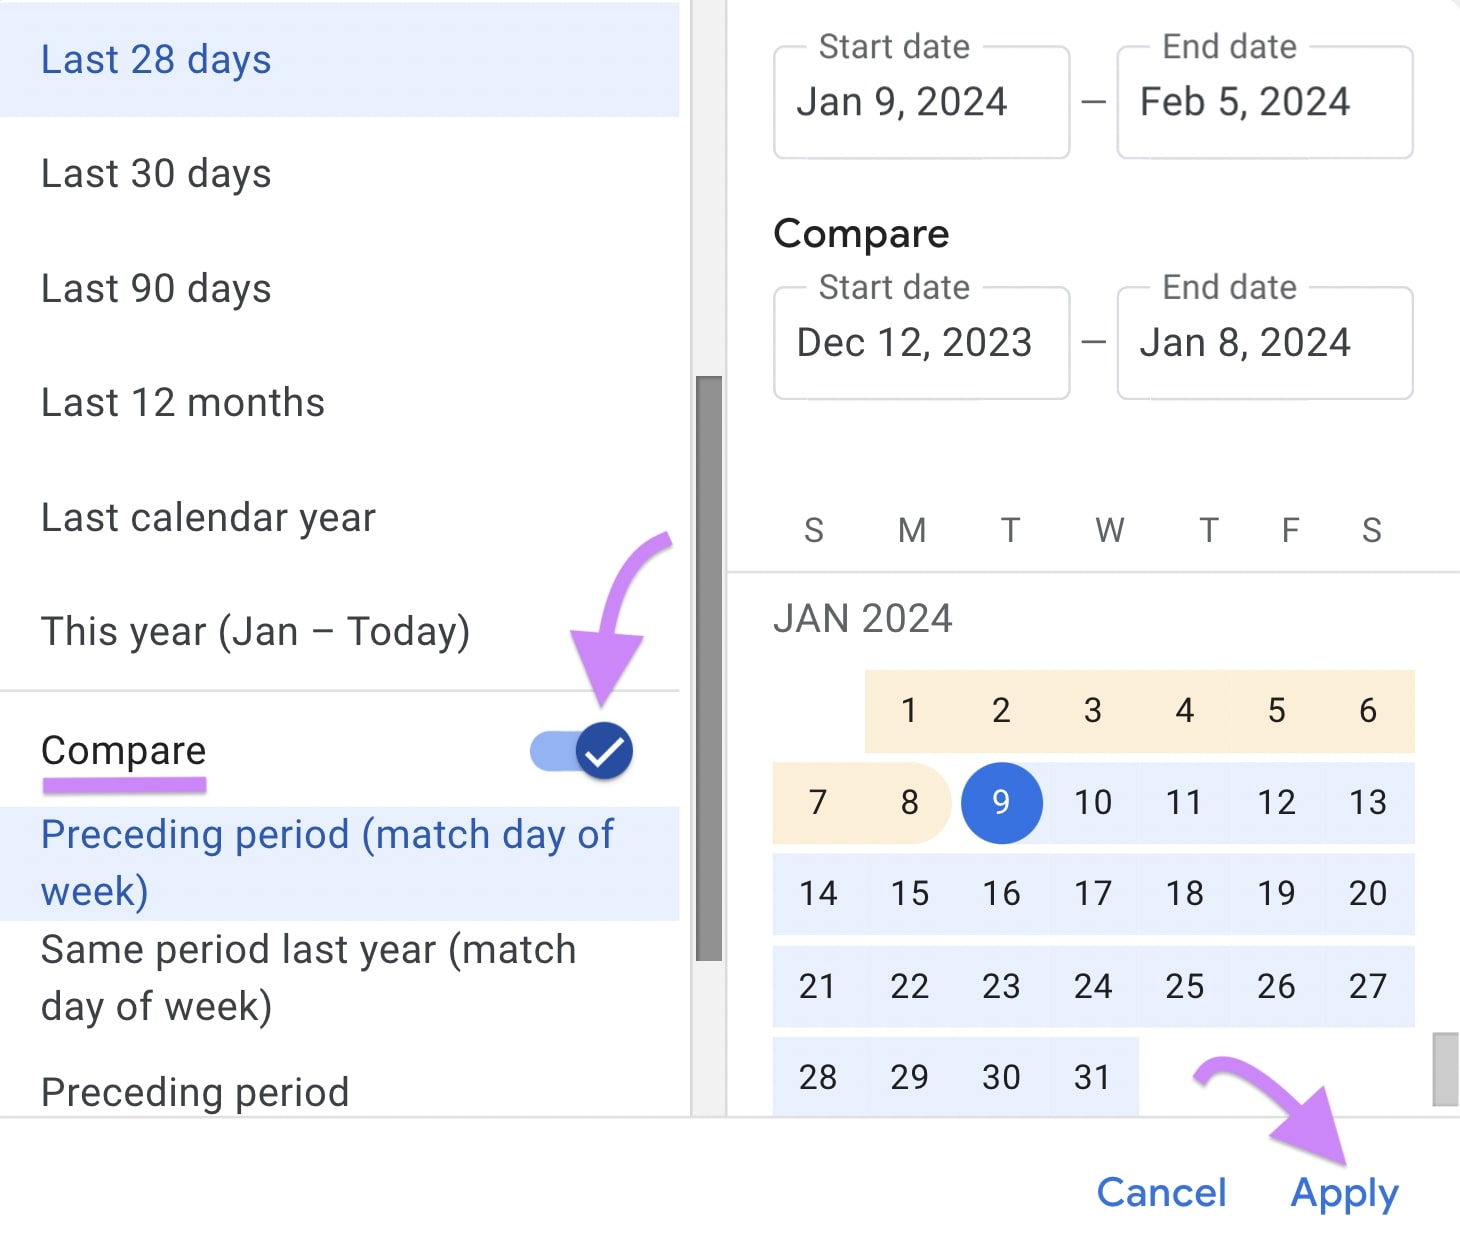
The updated dashboard will now contain two data sets: dark blue for the most recent period and light blue for the preceding period.
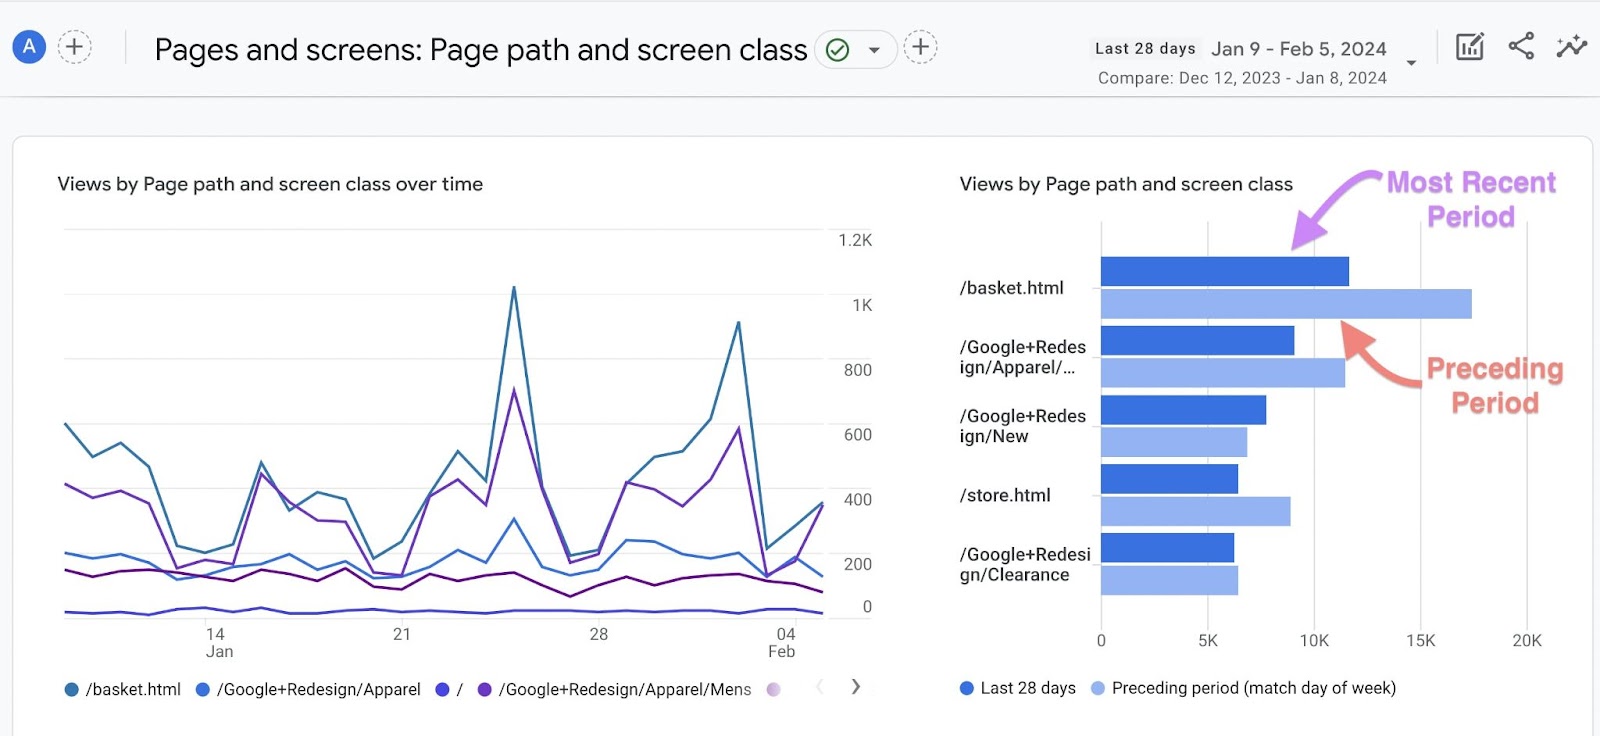
Scroll down to the table to see whether pageviews have increased or decreased compared to the preceding period for each page path.
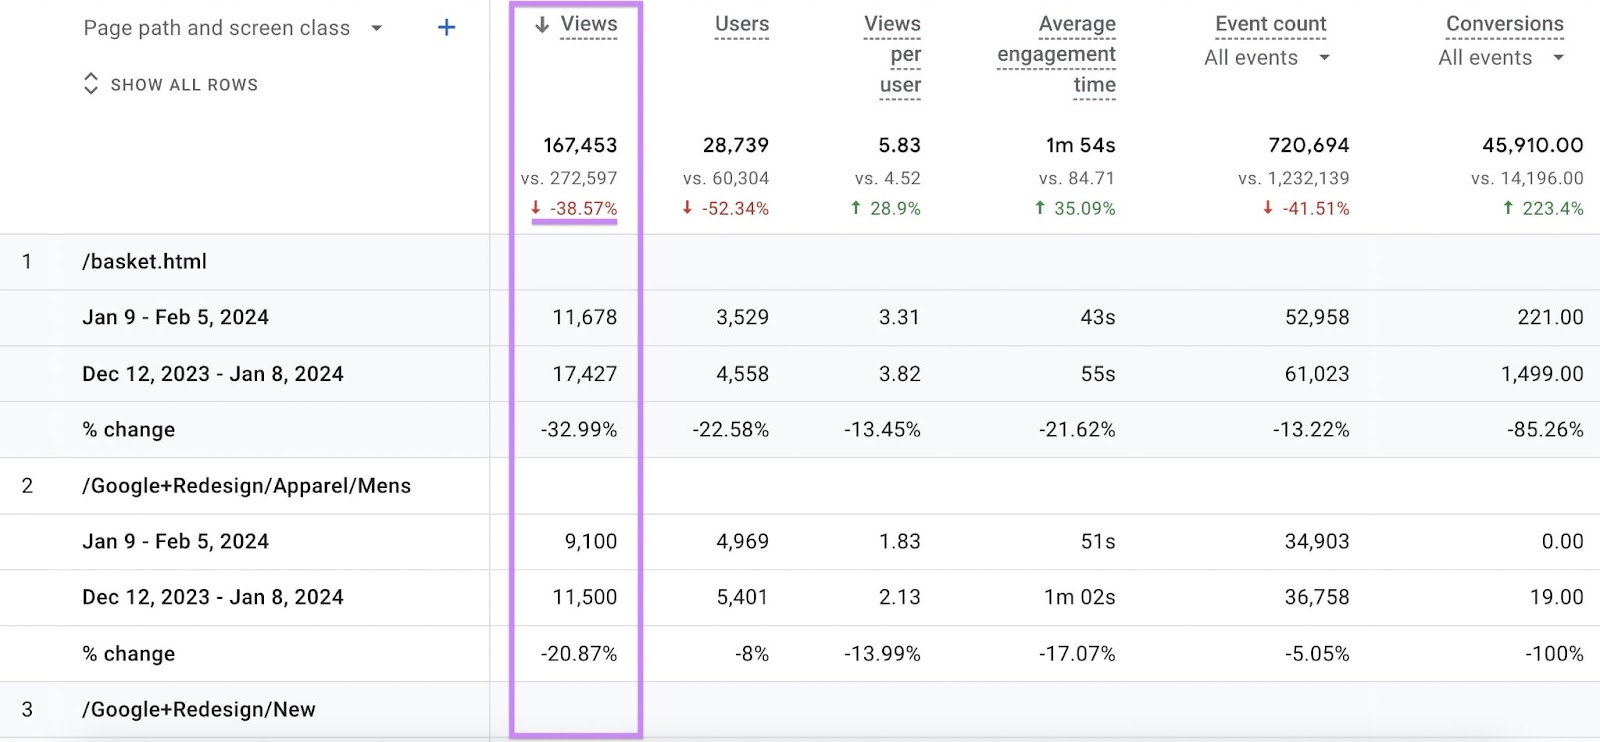
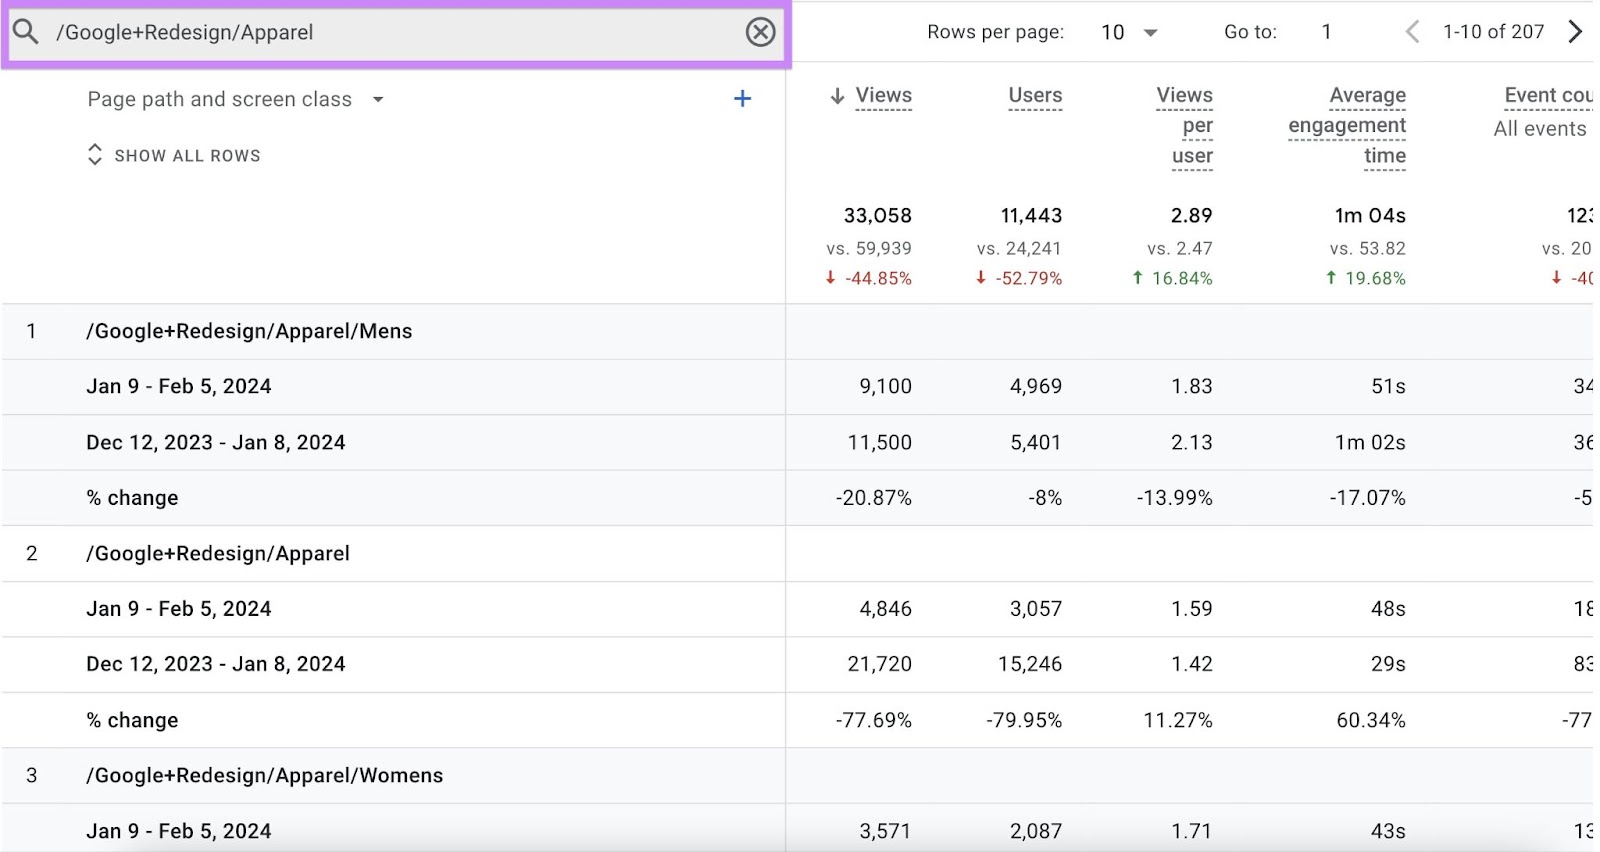
You can use the search bar to type in a word or URL to isolate views data for a specific page or group of pages.
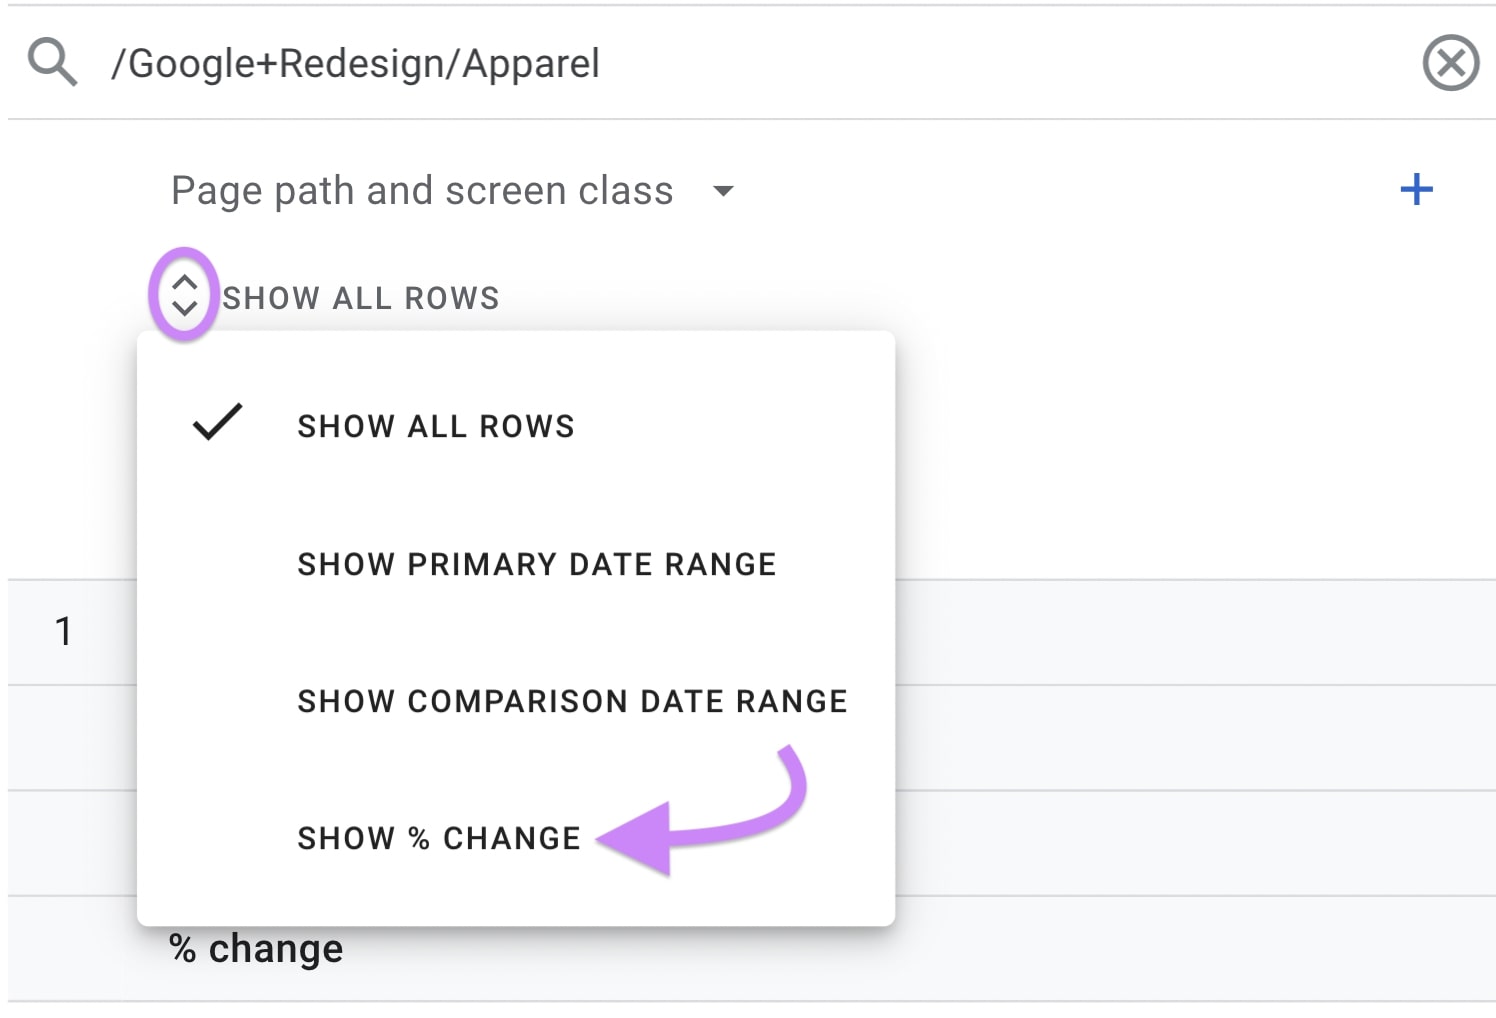
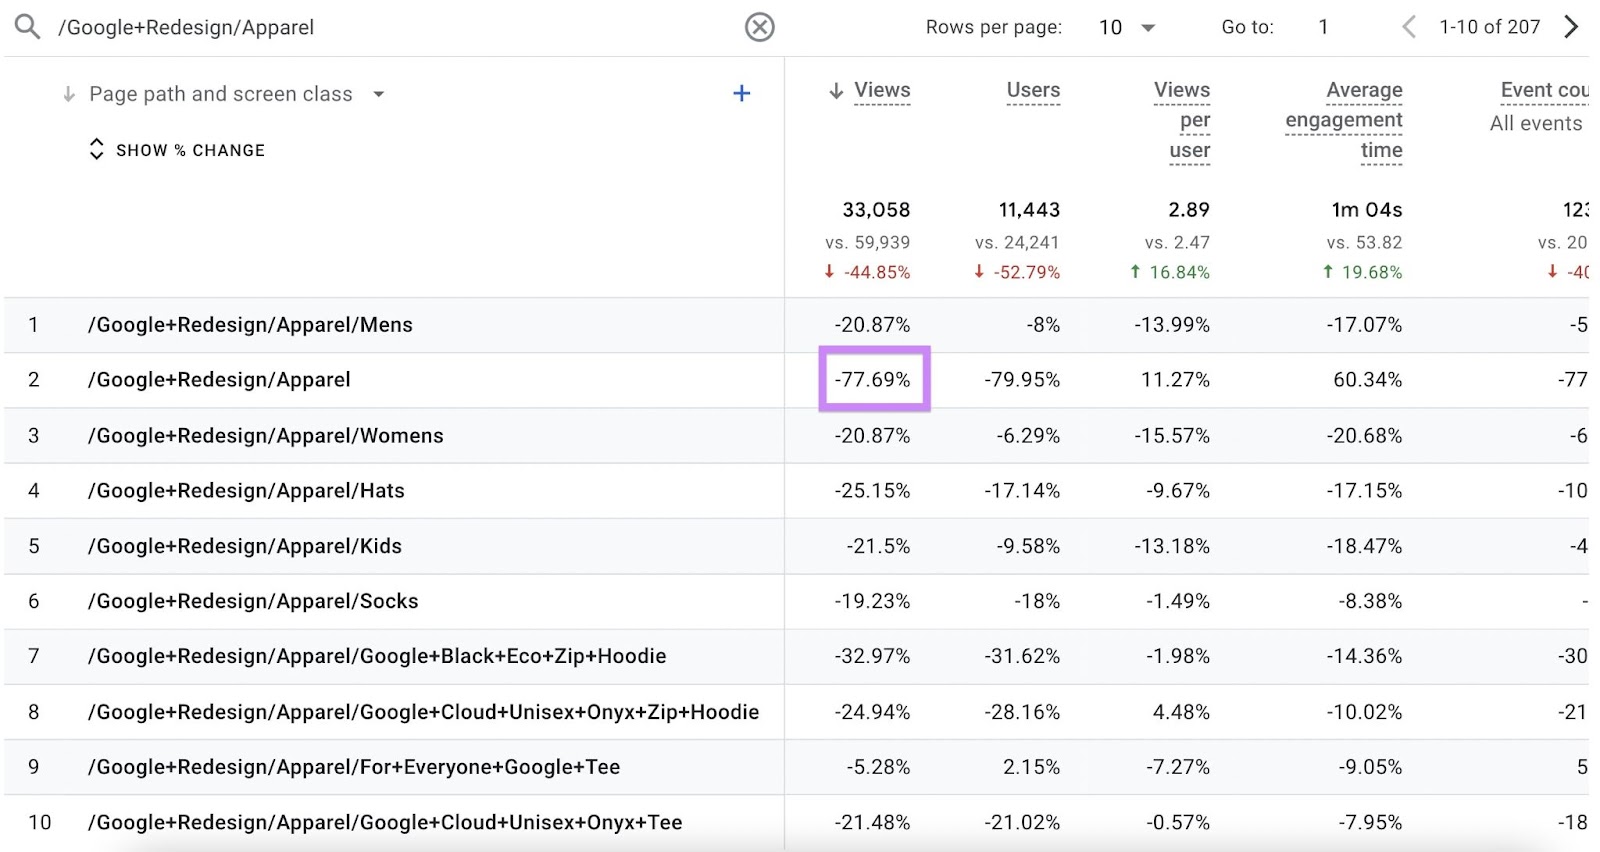
If you only want to see the percentage change over time, click the “Show All Rows” option and then select “Show % Change.”
This is handy for quickly identifying which pages have lost significant traffic over time. In the example below, the second row stands out because its views have dropped by 77.69%.
It could be worth analyzing this page to understand why there has been such a decline. And updating it where necessary.
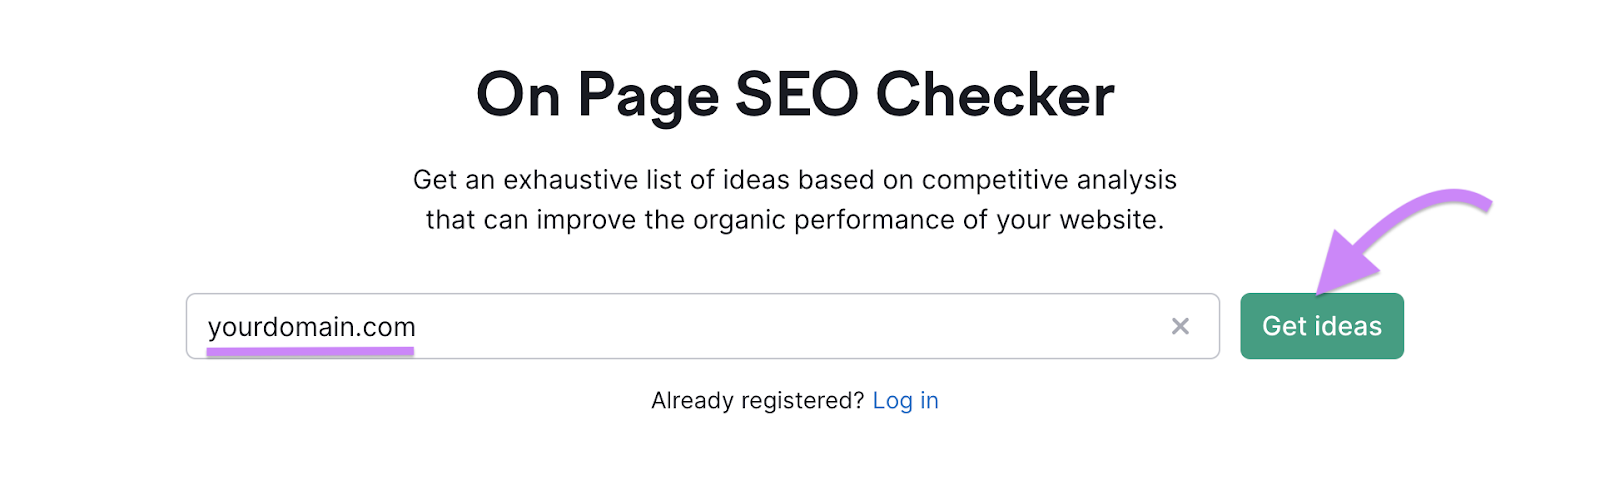
When you find pages you want to update to increase their pageviews, you can boost your efforts with a tool like Semrush’s On Page SEO Checker.
It will analyze your webpages and identify SEO weaknesses that may be impacting your content’s performance in search. Then, you’ll receive tailored recommendations to quickly fix them and help grow your traffic.
Get started by entering your domain name into the search bar and click “Get Ideas.” (If you’ve used the tool before, you’ll need to click “+ Create Project” instead.)
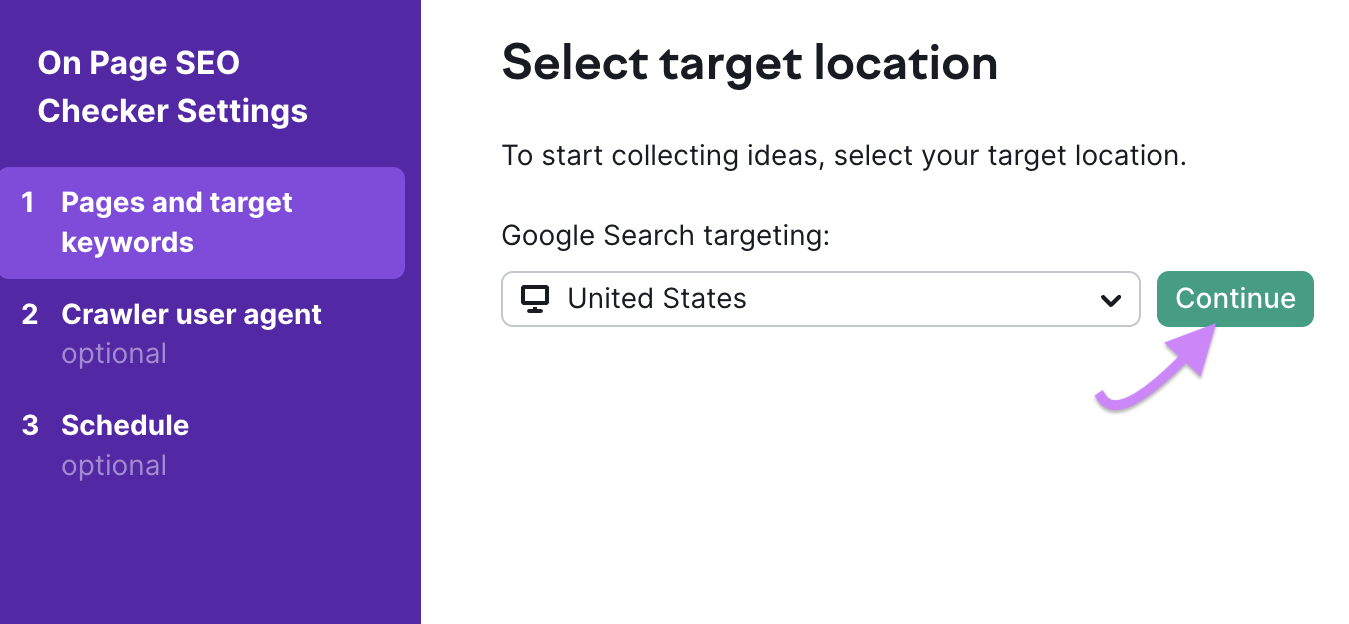
Then, select your target location, and click “Continue.”
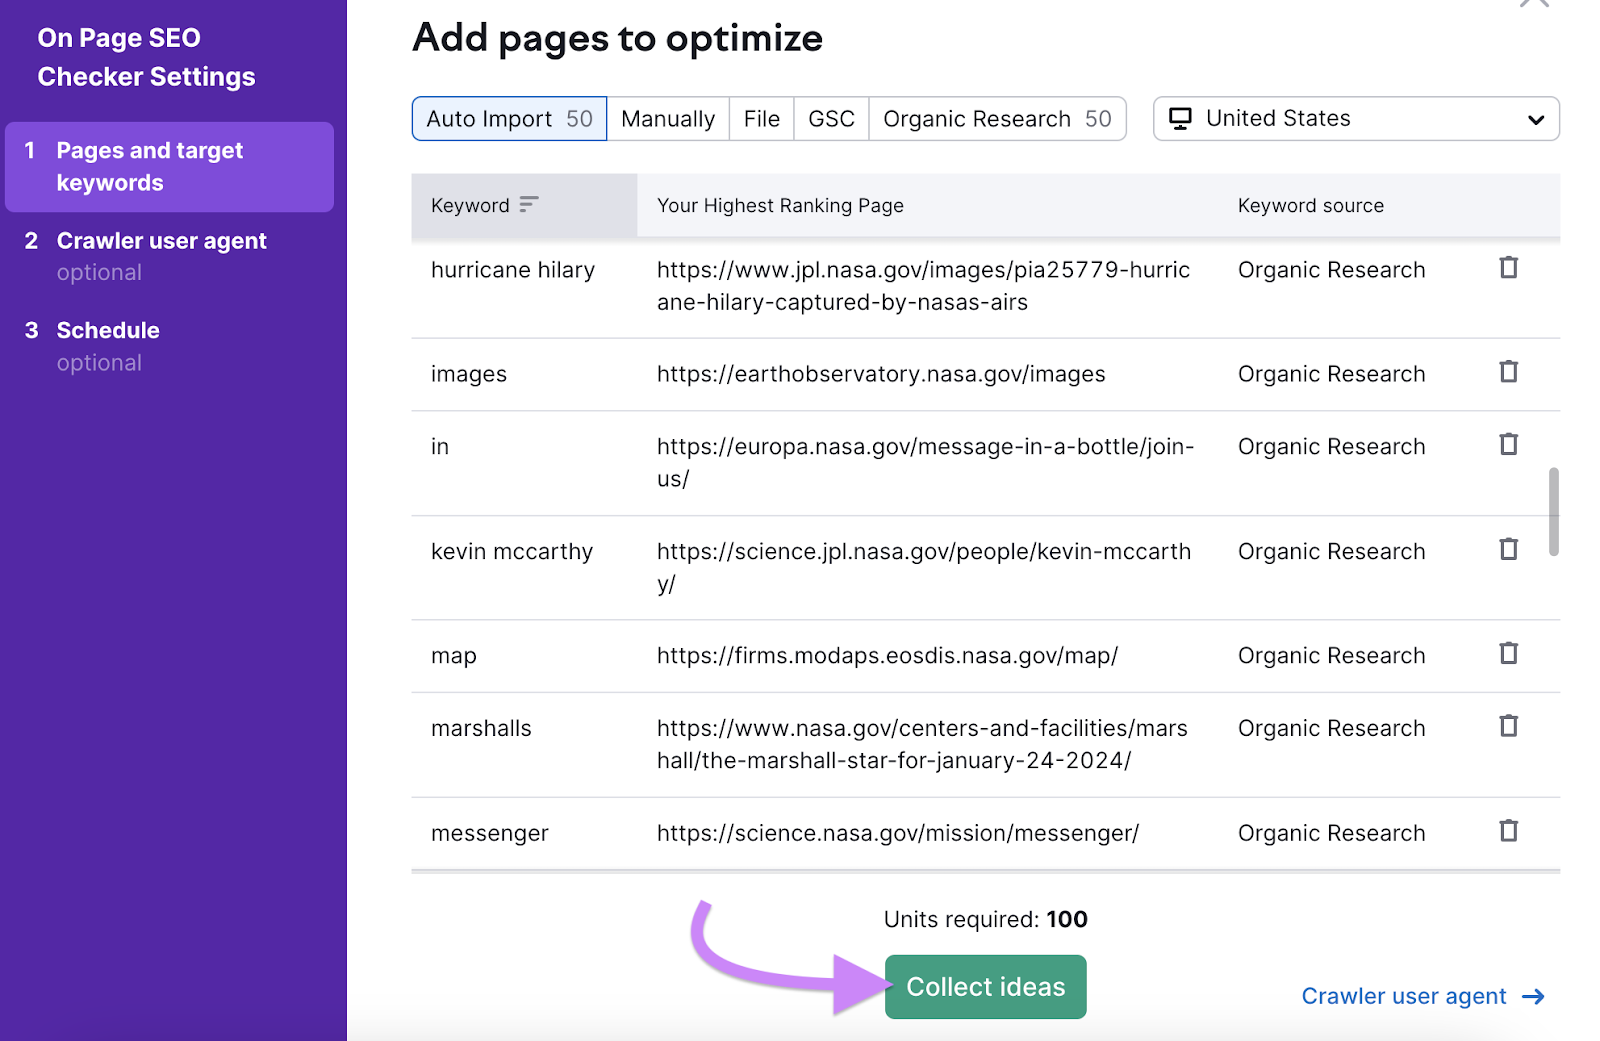
Add pages you want to optimize. Semrush will automatically generate a list for you but you can also import a CSV file, or you can use Google Search Console (GSC) or Organic Research data.
When you’re ready, click on “Collect ideas.”
When your dashboard is ready, click on the “Optimization Ideas” tab to explore the suggestions.
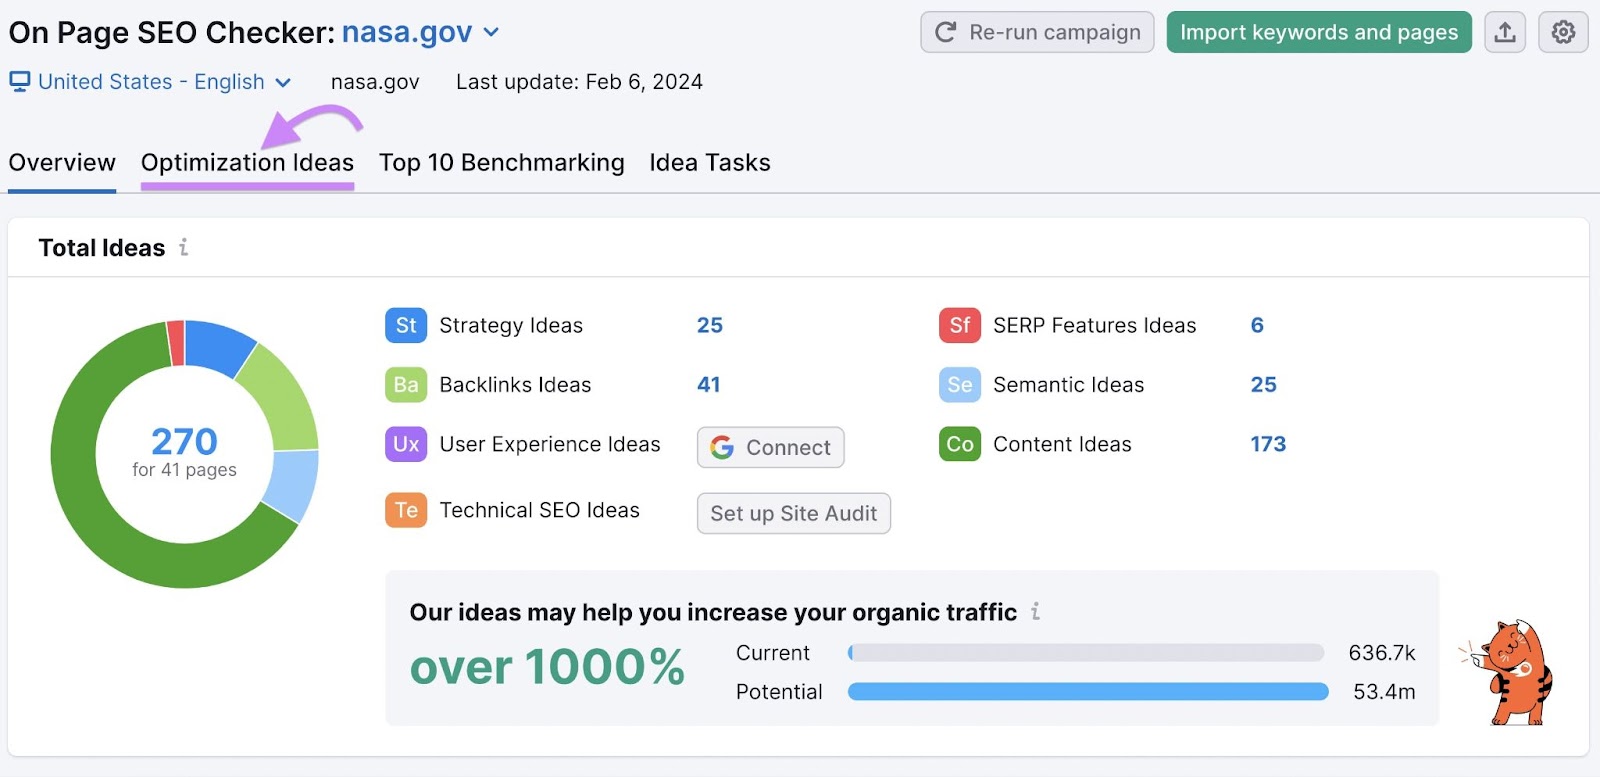
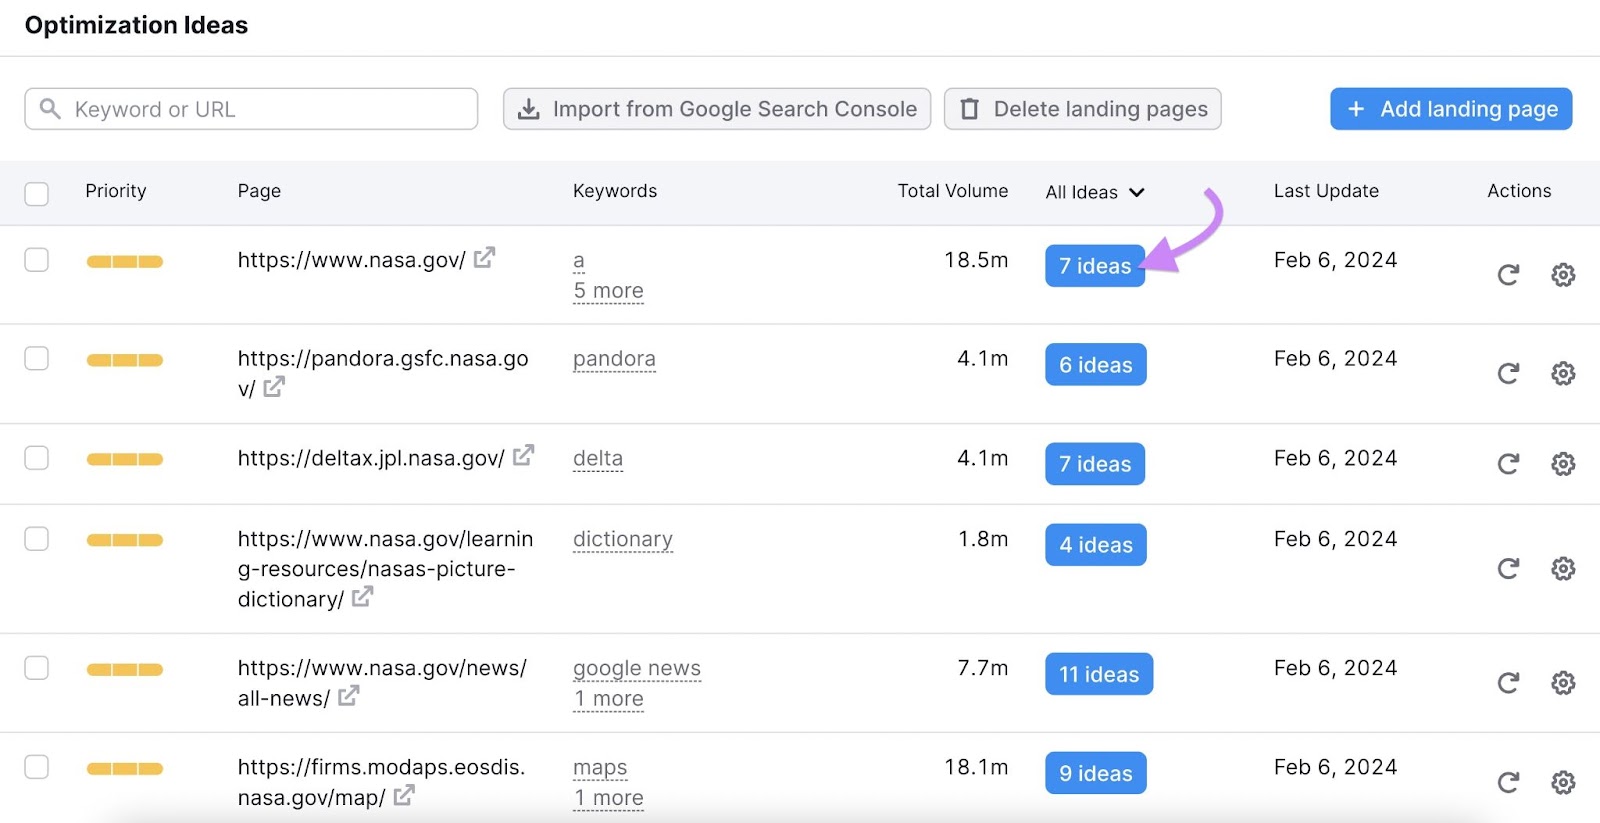
Click on the blue buttons in the “All Ideas” column to see optimization suggestions for each page.
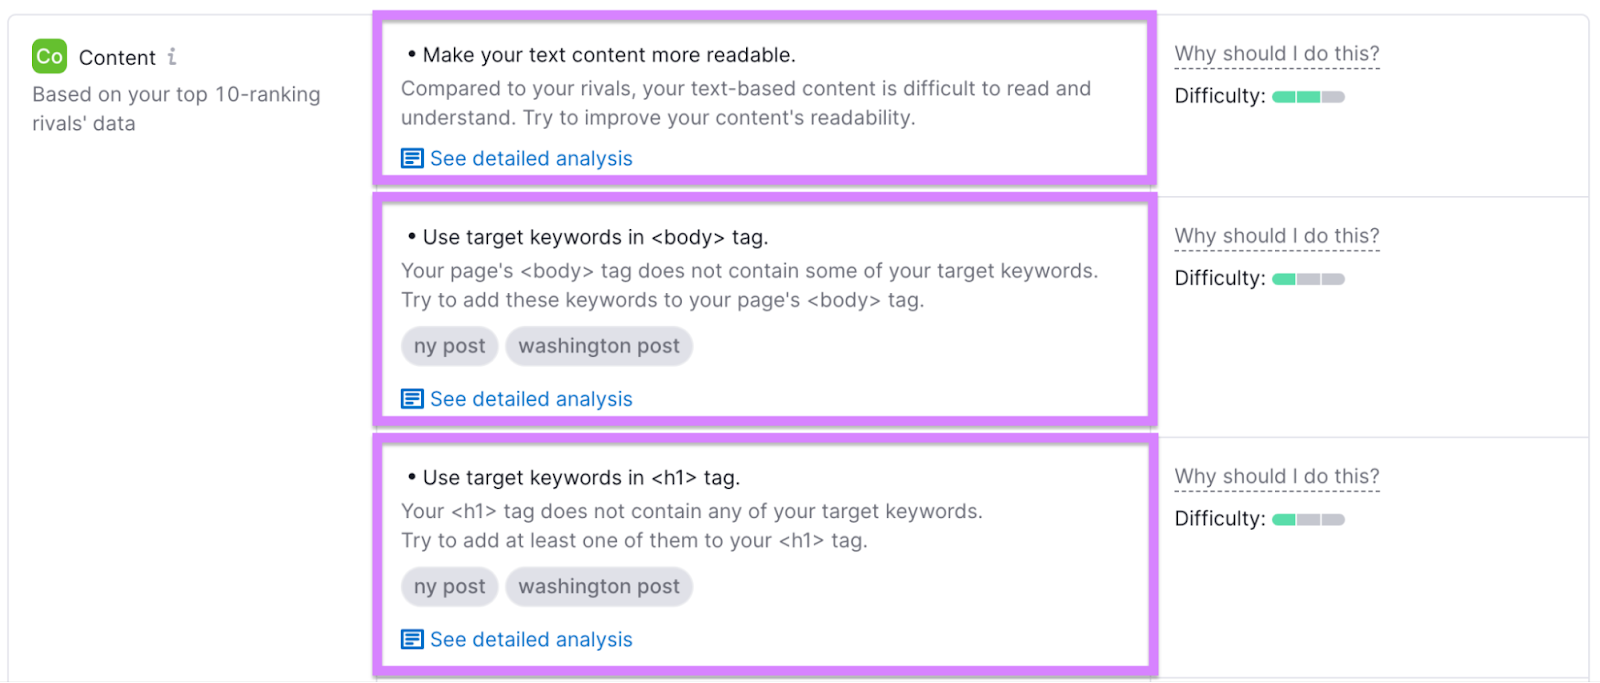
In this example, the content suggestions include improving readability and adding target keywords to different parts of the page. You can click the “See detailed analysis” button to learn more about each recommendation.
Now, you’re ready to implement these optimization ideas to improve your search rankings and attract more visitors to your site.
Amplify Your Pageview Analysis with Semrush
Pageview data is essential to analyze and improve your website performance.
And with Semrush tools like Organic Traffic Insights and the On Page SEO Checker, you can get valuable SEO insights and tips to take your analysis one step further.
Sign up for a free trial today.