
Key Performance Indicators, or KPIs, are metrics used to measure progress toward a specific goal. For marketing agencies, this could be something like improving Conversion Rate by a certain percent, reducing Cost Per Acquisition by a certain amount, or getting into the top 10 SERP for target keywords. Whatever the goal is — and it can be almost anything, depending on the project you’re working on, or the specific needs or goals of your client — it needs to be something that can be measured quantitatively and tracked over time.
Marketing KPIs are often (though not always) tied to specific campaigns. They act as an objective indicator of whether that campaign was successful. For example, if one social media campaign had a KPI of increasing Twitter impressions by 10%, the marketing team executing the campaign would monitor that KPI, and adjust their strategy as needed to make sure they reach the finish line.
But remember: just because you’ve identified your KPIs doesn’t mean you should forget about all the other metrics. Make sure you’re still actively monitoring related metrics as your campaign progresses, just in case the changes you’re making have a negative impact. For example, if that social media campaign successfully beat their Twitter impressions KPI, but lost followers in the process, that would still be a negative outcome.
Marketing KPIs vs. Marketing Metrics
So, are all of your marketing metrics KPIs? The short answer: no. But they could be, in the right circumstances.
A marketing metric is any measurable value generated by one of your marketing processes. In other words, can you measure it? If so, it’s a metric. But that doesn’t mean that metric is relevant to your goals right now, and in order to become a KPI, it must be relevant.
A marketing metric becomes a KPI when it directly aligns with a specific marketing goal that you’re trying to achieve, and when you define “success” for that metric as it relates to your goal, and then use it to measure your progress over time.
For example, say, for Campaign A, your team wants to increase your click-through rate on a certain set of landing pages. Your team decides that a successful campaign will increase the CTR by 10%, and then tracks their progress by monitoring the CTR and course-correcting as needed.
Overall, the pathway from marketing metric to KPI looks like this:
- Identify a goal you want to achieve with a campaign or project.
- Identify all of the metrics that could be relevant to that goal.
- Figure out which metrics are the most important to focus on for that goal.
- For the most important metrics, define, specifically, what success “looks like” for this project. These are your KPIs.
- Identify other, related metrics to watch that, while not connected to your goal, could still be impacted by your activities.
- Monitor those KPIs and related metrics while executing your marketing campaign, and use that data to inform your strategy.
Why Do I Need to Track KPIs for Marketing?
Marketing KPIs can help you to clarify the entire process of developing, executing and analyzing your marketing campaigns. That’s because, if you want to use KPIs, you’ll first have to define:
- What your actual goals are for this campaign
- How you’re going to measure success for those goals
- Specifically how you plan to achieve those goals
- Which metrics are actually relevant when analyzing this project
In other words, KPIs can act as an early gut-check to make sure your campaign is fully developed. Identifying your KPIs means you know what success looks like for that project, and can then make sure that your strategy is tailored toward it.
Because KPIs are tied to the goals of a campaign, they can also help your team align and prioritize more effectively. Once you’re executing the campaign, they can even help you to self-evaluate, and if you face unexpected challenges and need to update your strategy accordingly, monitoring your marketing KPIs will help you to identify that problem.
KPIs are also an important part of your marketing campaign’s post-mortem. Using KPIs, you can identify which goals you exceeded, met, and fell short on. Then you can make recommendations on how you could do better next time, and use those findings going forward.
Another advantage KPIs can bring to your marketing team: because they are quantitative, they can help demonstrate your team’s value to upper management and clients in a more objective way.
All of that said, the most important takeaway regarding KPIs for marketing agencies is relevance. By identifying marketing metrics closely related to your specific goals for each project, you can target them as KPIs to ensure that your team is working effectively to support your client’s goals and your organization as a whole.
Keep reading to learn about the key marketing metrics and KPIs you should pay attention to.
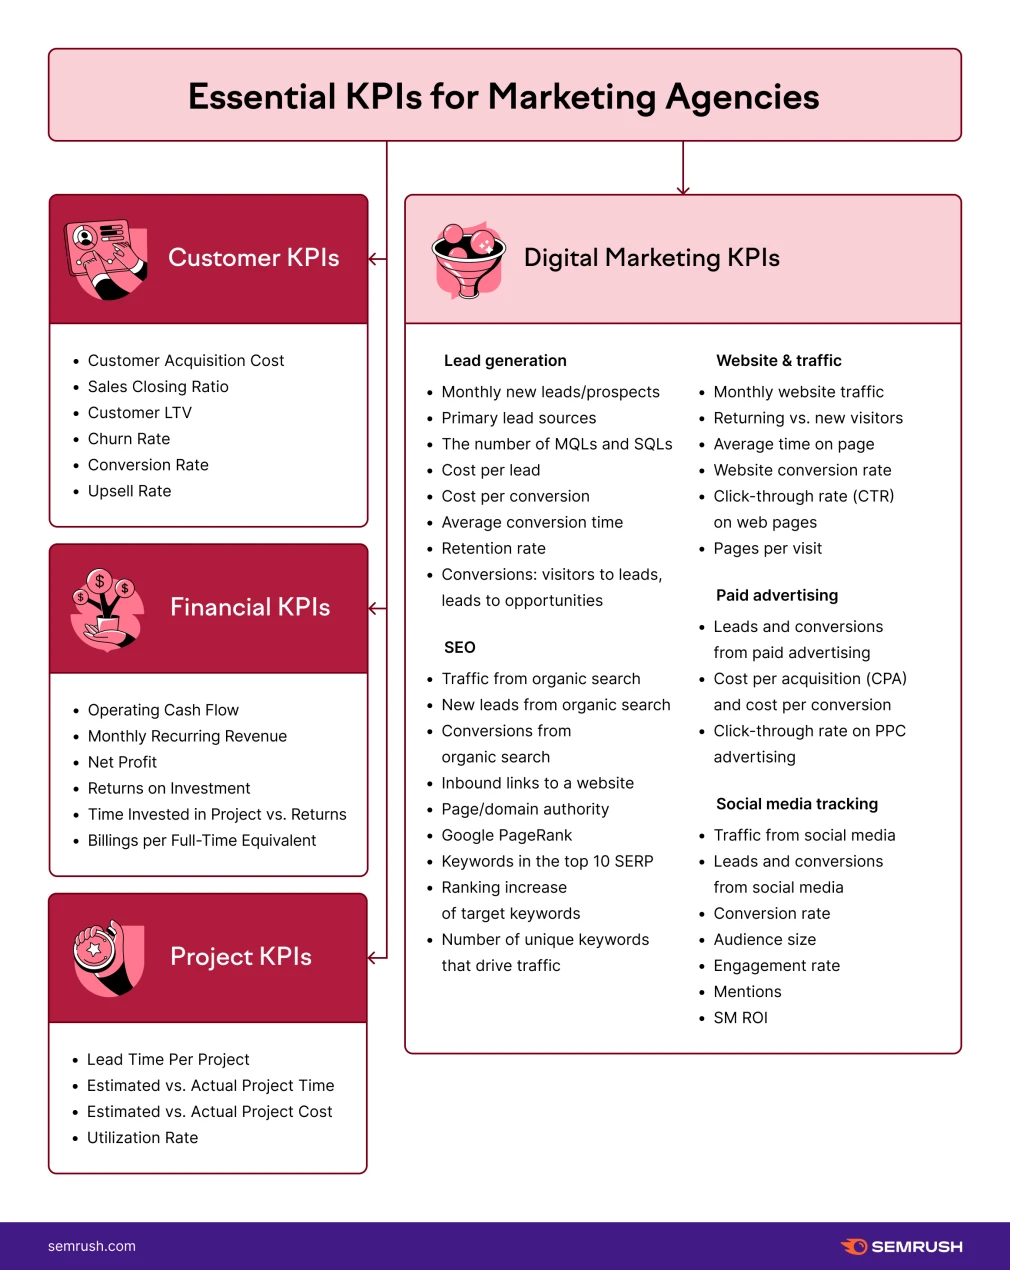
6 Customer KPIs Marketing Agencies Should Track
1. Customer Acquisition Cost (CAC)
Customer Acquisition Cost (CAC) is a powerful metric that calculates the estimated cost of acquiring a new customer. On a basic level, you can calculate it by dividing the total marketing spend by the number of new customers acquired over the course of a campaign.
Customer Acquisition Cost (CAC) = Cost of Marketing / New Customers Acquired
How to decrease: To decrease your CAC, try focusing on:
- Optimizing your conversion rate
- Creating more powerful marketing strategies
- Optimizing your copy to draw more organic traffic
- Taking a closer look at your marketing spend, and eliminate unnecessary costs
2. Sales Closing Ratio
Sales Closing Ratio measures the efficiency of the sales process. You might choose to calculate this by individual salespersons or collectively. To calculate it, divide the number of successful sales (closes) by the total number of leads for that campaign. Then multiply the result by 100. This is the ratio of closes to leads expressed as a percentage.
Sales Closing Ratio = Closed Deals / Total Sales Leads * 100
How to improve: Here are some ideas for improving your sales closing ratio:
- Examine your sales process to identify any specific weak points
- Asking for feedback to find out more about why potential customers went in a different direction
- Make sure your marketing materials are clearly expressing the value of your product
3. Customer LTV
Customer LTV refers to the average overall value a customer brings throughout their entire relationship with a business. In other words, how much they spend on your products.
One simple way to calculate LTV is by subtracting Lifetime Customer Costs from the Lifetime Customer Revenue. In order to calculate this effectively, you’ll need to make sure you have a large enough sample size.
Customer Lifetime Value (CLTV) = Lifetime Customer Revenue - Lifetime Customer Costs
4. Churn Rate
Churn Rate refers to the number of customers that left a product or service over a given period. The simplest way to calculate this is to divide the number of lost customers for a given period by the total number of customers at the start of that period.
Customer Churn Rate = Lost Customers / Total Customers * 100
How to decrease: To reduce your churn rate, focus on increasing customer retention. First, do some research to find out the reasons those customers might have left. Then address those issues if possible, and try to add value to your product to entice more customers to stay.
5. Conversion Rate
Conversion Rate refers to the rate at which people who interact with your advertising follow through with a certain action. That action could be something like contacting your business, or a purchase. To calculate it, divide the total number of conversions by the total number of interactions.
Conversion Rate = Total Conversions / Total Interactions * 100
How to improve: If you need to improve your conversion rate, take a closer look at your content, and make sure it closely aligns with the products or services a customer could expect if they click on your ad. Then make sure your landing page is clear, consistent, and accessible to users.
6. Upsell Rate
Upsell Rate is the number of customers who purchased additional products or services (i.e. an upsell) divided by the total number of customers.
Upsell Rate = Total Upsells / Total Customers * 100
How to improve: If you’d like to improve your upsell rate, first make sure you’re offering something customers are looking for. Then revisit your sales process. Make sure those opportunities are being communicated effectively and are easily accessible by your customers.
5 Financial KPIs For Marketing Agencies
1. Operating Cash Flow (OCF)
Operating Cash Flow (OCF) is the amount of money generated by your day-to-day business operations. It’s a useful benchmark for determining how stable and healthy your business growth is. On a very basic level, this is the total cash generated by sales minus your operating costs.
Operating Cash Flow (OCF) = Total Revenue - Operating Expenses
How to improve: To improve your operating cash flow, in addition to working to increase sales, take a closer look at your operating costs and see if you can reduce them.
2. Monthly Recurring Revenue (MRR) / Monthly Recurring Profit
Monthly Recurring Revenue (MRR) is the amount of revenue generated over a given month that is expected to continue. Some examples include ongoing contracts or monthly subscriptions. As a result, it’s pretty simple to calculate. Simply take the cost of the service or subscription and multiply it by the number of subscribers that month.
Monthly Recurring Revenue (MRR) = Cost of the Service or Subscription * Customers
If you find it more useful, you can also calculate your Monthly Recurring Profit. All you have to do is take your MRR and subtract your expenses from that month.
Monthly Recurring Profit = Monthly Recurring Revenue - Expenses This Month
3. Net Profit / Net Margin
Net Profit is the amount left over after you subtract your expenses and operating costs from your total revenue. If this figure is lower than you’d like it to be, it could be that you incurred too many expenses, or that you need to increase your sales. Closely examine both of these issues to maximize your chances of success.
Net profit = Total Revenue - Total Expenses
If you want an even clearer picture, try also calculating your Net Margin, which is how much profit is generated as a percent of total revenue. All you have to do is divide your net profit by your total revenue. To express it as a percent, multiply the result by 100.
Net Margin = Net Profit / Total Revenue * 100
4. Return on Investment (ROI)
Return on Investment (ROI) measures how profitable or efficient your activities or campaigns were for your business. To calculate the ROI of a marketing campaign, first, subtract the marketing costs and the average organic sales growth from your total sales growth. Then divide the result by your marketing costs.
Return on Investment (ROI) = (Total Revenue - Total Cost) / Total Cost *100
5. How to improve: to improve this figure, first, try and increase the efficiency of your marketing spend. Track the number of hours your team spent on a campaign, compared to its ROI to see how efficient your team’s activities were and find areas of improvement. Also, take a closer look at sales-related KPIs like the Sales Closing Ratio and Customer Churn.
The 32 Best KPIs for Digital Marketing for Agencies
Top Lead Generation KPIs
Lead generation KPIs focus on how effectively your marketing efforts have attracted potential new customers. As any marketing professional knows, a lot goes into lead generation, depending on the type of campaign you’re running and that user’s specific journey to finding you. Here are a few important lead generation KPIs to track:
1. Monthly new leads
By tracking the number of new leads generated each month, you can get a bird’s eye view of how effective your marketing efforts are overall. If you see a sudden, sharp decline, take a closer look at those campaigns and how they could be more effective.
2. Primary lead sources
In other words, how did your leads find out about you? By keeping track of how many leads are generated by each source (organic search, digital ad campaigns, referral traffic, social media, etc.) you can get an idea of where your audience is and which channels are most effective for you.
3. Marketing Qualified Leads (MQLs)
These leads have somehow indicated that they are interested in your product or service based on marketing efforts. Often, this means they’ve volunteered their contact info, filled out a form to download a white paper, opted into a newsletter, etc. Tracking how many MQLs you generate each month can be a useful indicator of how effective your campaigns are, and how much marketing has contributed to the overall sales process.
4. Sales Qualified Leads (SQLs)
When MQLs are passed on to the sales team, the sales team then determines whether they get to become a Sales Qualified Lead (SQL). The specific criteria may vary, but generally, teams qualify leads by comparing MQLs to their ideal customer profile (demographics, industry, location, etc). If too few MQLs are becoming SQLs, it may be useful to revisit your marketing strategies to make sure you’re attracting the type of customer you want.
5. Cost per lead (CPL)
Also a digital advertising pricing model, in the context of digital marketing KPIs, cost per lead refers to the amount of marketing spend per lead generated. To calculate it, divide your total marketing spend for a campaign by the number of leads generated by this campaign.
Cost per Lead (CPL) = Total Amount Spent / Total Leads
How to improve: To improve your CPL, first, try narrowing your target audience to make sure that the people seeing your ad are actually the ones you want. If that’s not the right strategy for you, try segmenting your audience so that you can target each segment more accurately. Finally, take a close look at your ad content and make sure it’s both interesting and effective, with a clear call to action.
6. Cost per conversion/ Cost per acquisition (CPA)
Similar to cost per lead, cost per conversion calculates how much it cost for a campaign to acquire actual customers. To calculate it, divide the total marketing spend for that campaign by the number of conversions.
Cost per Acquisition = Total Amount Spent / Total Conversions
7. Average time of conversion
This metric looks at how long, on average, it takes a customer to convert and can measure how efficient the conversion process is. To calculate it, you first need the sum total of all transaction time for the period or campaign you are analyzing. Divide that sum by the number of conversions.
Time of Conversion = Total Transaction Time / Total Conversions
8. Customer Retention Rate (CRR)
This metric measures the rate at which existing customers continue doing business with you. It can show how satisfied and loyal your customers are with you — and, conversely, act as a red flag when there’s a sudden decline. Calculate your CRR by subtracting the number of new customers from the total number of customers at the end of the period you’re analyzing. Then divide the result by the number of customers you started with, and multiply the result by 100.
Customer Retention Rate (CRR) = (Customers at the end of the period - New customers) / Customers at the beginning of the period * 100
How to improve: To improve your CRR, the first step is to take a closer look at the customers you did lose and try to identify why. Was there a recent change in your product, service, or other activities — or have you received any feedback from them? Some other useful strategies include fostering a robust customer feedback system to nip potential issues in the bud, increasing your customer education efforts, offering loyalty incentives, and communicating more regularly and directly with your customers.
9. Conversions
There are a few different types of conversions you could track in digital marketing. Calculating your visitors to leads conversion rate can show you how effective your digital ad campaigns and web copy are at attracting potential customers. Calculating your leads to opportunities conversion rate can show you how targeted your campaigns are, and whether they’re attracting the right types of leads.
An important thing to remember when tracking conversions: it’s more useful to look at conversion in relation to specific data slices (e.g. mobile conversion, by location, etc.). This will result in more actionable data, which you can use to improve.
Top Website and Traffic KPIs
Website and Traffic KPIs focus on how effective your website is at attracting visitors, keeping their attention, and providing the information they’re looking for. In other words: whether people are finding the site at all, and how much time they spend interacting with your content. Here are a few KPIs to consider:
10. Monthly website traffic
This refers to how many unique sessions (visits) your website received over the past month. This figure can be impacted by organic SEO, marketing campaigns, and user experience, just to name a few factors.
11. Returning vs. new visitors
Comparing the number of returning visitors each month to the number of new visitors can tell you two things: first, whether you’re successfully attracting new visitors with your content, and second, whether those visitors connect with your content enough to want to keep coming back.
If your returning visitors are too few, it might be that your website is difficult to navigate, or that they’re not finding the information they’re looking for. If you are not attracting enough new visitors, you might need to strengthen your SEO.
12. Average time on page and session duration
Average time on the page refers to the average amount of time a user spends on a single page (i.e. reading your blog post), whereas session duration tells you how long a user spent on your website as a whole, across all the pages they visited, excluding entrance and exit pages.
If either of these metrics is too low, take a closer look at your content. Think carefully about the type of information a user might be looking for when visiting that page, and make sure that the content you have aligns with those expectations and is substantive enough to keep their interest.
13. Website conversion rate
To measure your website conversion rate, simply divide the number of conversions for the campaign or period you’re analyzing by the total number of sessions. To express this as a percent, multiply the result by 100. This can be a useful metric to demonstrate the value of your website as part of the sales process.
To improve your website conversion rate, make sure that you’re providing convenient opportunities for users not only to learn about your products or services but also to get in touch with you about it. Check that all the most important information (including an easy way to contact you) is present on every page where it would be relevant.
14. Click-through rate (CTR)
At a basic level, CTR is the rate at which people click on a link that takes them to another page. As such, you can measure CTR for organic search, digital ad campaigns, or even internal links on your own website. To calculate it, simply divide the number of clicks by the number of impressions, and multiply the result by 100 to express it as a percent.
Click-through rate (CTR) = Clicks / Impressions * 100
To improve your CTR, take a closer look at the context surrounding those links. Are the links visually clear and obvious to the user? Are you providing enough detail, so that users know what to expect when they click — and does the landing page match those expectations? Are the links relevant to that page, and do they provide sufficient value to the user?
15. Pages per visit
Often displayed as an average of all users, this metric refers to the number of pages a user typically visits on your website during a single visit. You can calculate this by dividing the number of page views by the number of visits during a given period. Used in conjunction with the average time on page and session duration, it can help paint a more comprehensive picture of how your visitors interact with your website.
Top SEO KPIs
SEO KPIs examine how effective your website is from an organic search perspective. In other words, they help you to understand how easily visitors can find you when spontaneously searching on Google (or their preferred search engine), excluding paid search.
16. Organic Search Traffic
This measures, specifically, the traffic your website (or an individual landing page) received over a given period that originated with an organic search query. There are a number of ways you could choose to look at this data, including the number of sessions, users, or new users that visited your site. A tool like Organic Traffic Insights can help you track and analyze this.
17. Leads and Conversions from Organic Search
In other words, how much of your organic traffic takes the next step by becoming a lead. This could be through contact forms, landing pages, etc. You can measure this in Google Analytics by setting up your Conversion Goals. Your goal conversion rate is equal to the total number of goal conversions (i.e. the specified activity, such as completing a contact form or making a purchase) divided by the total number of organic sessions.
18. Backlinks
As one of Google’s top-ranking factors, tracking your backlinks is a crucial part of any SEO strategy. Key metrics include the total number of backlinks leading to your domain, the number of unique domains giving you backlinks, the number of links lost and earned each month, and toxic backlinks. Some useful tools for tracking your Backlink KPIs include our Backlink Analytics and Backlink Audit tools.
19. Authority Score
This metric was developed by Semrush to analyze a site’s overall quality and SEO performance. A number of other metrics contribute to this score, including traffic, organic search, and the number, quality, and nature of your backlinks, and is displayed as a value of 100.
20. Google PageRank
Google’s PageRank may not be publicly available anymore, but it’s still a major factor in your website’s organic performance — and why a solid backlink strategy is so important. As such, it’s important to make sure to collect as many high-quality, relevant backlinks from other authoritative sources as possible.
21. Keywords in the Top 10 SERP
Which and how many keywords your domain ranks in the top 10 for is a huge indicator of how successful your SEO strategy is. Our Position Tracking tool can help you track and analyze your performance overall and compared to the competition.
22. Rank Increase of Target Keywords
Is your current SEO campaign trying to increase your SERP rank for certain specific keywords? If so, tracking your position for those keywords over time is a crucial KPI for that project.
23. Number of Unique Keywords Driving Traffic
It’s important to know how many total keywords are bringing visitors to your site, not just the specific ones you’re targeting. Organic Traffic Insights, together with Google Search Console, can analyze how many keywords you’re ranking for and the amount of traffic they’re each bringing you.
Top Paid Advertising KPIs
Paid Advertising KPIs measure the effectiveness of your ad campaigns, including paid search, display advertising, social media advertising, and sponsored content. These KPIs are especially useful, because they can help analyze not just where leads and traffic are coming from, but also how efficiently your marketing dollars are being spent.
24. Leads and conversions from paid advertising
This metric measures how effective your paid ads are at generating leads or customers. You can analyze your paid advertising conversions with the Conversion Tracking tool in Google Ads, or within your preferred advertising platform. This metric is calculated by dividing the number of conversions (filling out a form, calling, completing a purchase) by the total number of ad interactions.
25. Cost per Acquisition (CPA) and Cost per Conversion (CPC)
Both Cost per Acquisition and Cost Per Conversion refer to the amount of advertising dollars spent for each attributed sale. CPA is the more commonly used term due to the fact that many paid advertising platforms use Cost per Click (also CPC) as a payment model. You can calculate your CPA by dividing the total amount spent on that paid advertising campaign by the number of conversions attributed to it.
26. Click-Through Rate (CTR) on PPC Advertising
Еracking your CTR is especially important in PPC advertising because, in addition to showing you how successful that ad is, in many cases, it also directly impacts the amount you pay for that ad. In Google Ads, your CTR is calculated by dividing the total number of clicks your ad received by the number of times the ad was shown.
Top Social Media Marketing KPIs
Social Media Marketing KPIs measure the impact your social media strategy has on your overall sales and marketing performance and help to demonstrate the overall value of an investment in social media. Here are some of the social media marketing metrics and KPIs you should be tracking:

27. Traffic from social media
You can track the amount of traffic referred to your website through social channels using Google Analytics. All you have to do is select the “Social” channel under “All Traffic.” You can also analyze your competitors’ social traffic using our Traffic Journey report in Traffic Analytics.
28. Leads and Conversion Rates from Social Media
An important measure of the effectiveness of any social media campaign, you can track your conversion rates from social media using UTMs and Google Analytics by selecting Acquisitions, then Social, then Conversions. You can calculate your conversion rate by dividing the total number of conversions by the total number of clicks.
29. Audience Size and Growth Rate
Audience size basically refers to the number of followers you have across your social media channels. You can calculate your audience growth rate by dividing your new followers across a period by your total follower count, and multiplying the result by 100. Calculating the growth rate can help you to analyze your social media campaign success and the overall health of your accounts.
30. Engagement Rate
This metric helps to illustrate whether the content you post resonates with your audience. Calculate the engagement rate of a post by dividing the total number of actions (replies, likes, etc.) by your follower count, and multiply the result by 100.
31. Mentions
Mentions are an important indicator of both engagement and brand awareness. You can track your mentions on your preferred social media management platforms, or by using our Brand Monitoring tool.
32. Social Media ROI
Calculating ROI for social media can be confusing because there are so many different ways you could define “return,” including everything from conversions attributed to social media to an increased follower count. However, the most basic way to calculate ROI for social media is to subtract the costs of your social media campaign from the total monetary value of your social media conversions, and then dividing the result by that same monetary value.
Top 4 Project KPIs For Marketing Agencies
1. Lead Time Per Project
Lead Time Per Project is a straightforward metric that measures the amount of time between a project’s initiation and delivery. In other words, how long will it take for a project to be finished after it was requested? You can typically track this using your preferred project management software. However, it might also be useful to calculate an average lead time across multiple similar projects as a simple benchmark.
2. Estimated vs. Actual Project Time
Estimated vs. Actual Project Time compares the amount of time you expect a project to take to its actual lead time, with a goal of being as accurate as possible. An accurate estimated project time can help you manage your team’s workload effectively, ensuring the team has enough time to deliver a quality result while remaining efficient.
3. Estimated vs. Actual Project Cost
Estimated vs. Actual Project Cost compares the estimated cost of a project with the actual amount of money spent to complete it. Cost estimation is crucial for keeping your project within budget constraints. This can be a complex process, so in project management, especially on larger projects and programs, many project teams have members that specialize in cost estimation. A key component of accurate cost estimation is a thorough understanding of what that project will entail, and the expected cost of each individual component.
4. Utilization Rate
Utilization Rate refers to the amount of time an employee spends on billable tasks, i.e. work directly related to the project in question. Utilization rate helps to determine how productive and efficient your team is, identify potential issues, and price your work accurately for clients. To calculate the utilization rate, divide total billable hours by total working hours, and multiply the result by 100.
Best Marketing KPIs for Client Reporting
When reporting to clients, the specific KPIs you need to include depend on a number of factors, including the type of work you’re doing, your specific goals for that project, the type and frequency of reports.
- Daily Marketing Reports are often used internally by an agency to quickly identify and resolve issues with an ongoing project. This could include things like daily traffic, social media performance, organic search positions, etc.
- Weekly Marketing Reports are a bigger picture compared to daily reports and often include a broader picture of traffic dynamics, social media metrics, etc. They focus on short and medium-term efforts and are often scheduled at the beginning of the workweek, so as to better plan for the week ahead.
- Monthly Marketing Reports provide a higher-level view of long-term projects. They are useful because they help you to better see the impact of your marketing activities over time. Information often included in monthly reports includes performance of traffic by channel, progress or completion of goals, and ROI.
- Monthly Competitor Analysis Reports are useful in better understanding why you faced certain challenges over the past month, such as ranking changes or increased cost per click.
- SEO Reports are usually sent on a weekly or monthly basis. They can help you or your clients to understand how organic traffic is changing over time, which keywords are the most effective for their audience, and SERP features.
- Backlink Reports help clients to understand their backlink profile and how it could be impacting their SEO. They can also help you to spot and resolve potential issues before you get penalized. These reports might include the number of backlinks gained and lost, toxic backlinks vs. healthy backlinks, the most used anchor text, and the number and type of links you’re receiving.
- Technical SEO Reports focus specifically on technical issues impacting the user experience and problems impacting the site’s ability to be indexed, such as crawlability. Factors that could be included in a Technical SEO Report include site speed, errors, AMP, mobile usability, security, and other issues.
- Social Media Performance Reports give a bird’s eye view of your social media performance and how it has changed over time. This includes factors like your audience growth rate, engagement, your level of activity over a certain period, and social media conversions.
- Brand Reputation Reports typically focus on brand mentions and how they contribute to the overall visibility and perception of your brand. This could include the number of mentions you received across all channels, the amount of traffic driven by those mentions, and sentiment.
To learn more about building effective reports for your clients and your own team and get 9 free report templates, check out our blog post on marketing report templates and examples.
Create Effective Marketing Reports with Semrush
Creating effective, engaging, and comprehensive reports for your clients is easier than ever with our My Reports tool, which empowers you to create and schedule PDF reports, customized to the needs of your clients or your team.
Using My Reports, you can:
- Create reports using a broad range of data, including Semrush, Google Analytics, Google Search Console, and Google My Business
- Save time using templates, or build a custom report from scratch
- Set your reports up once, and automatically receive them on a daily, weekly, or monthly schedule
Plus, the Agency Growth Kit allows you to customize your reports even further, using white labeling, branding, and design themes.